

Know your ground before you commit to it.
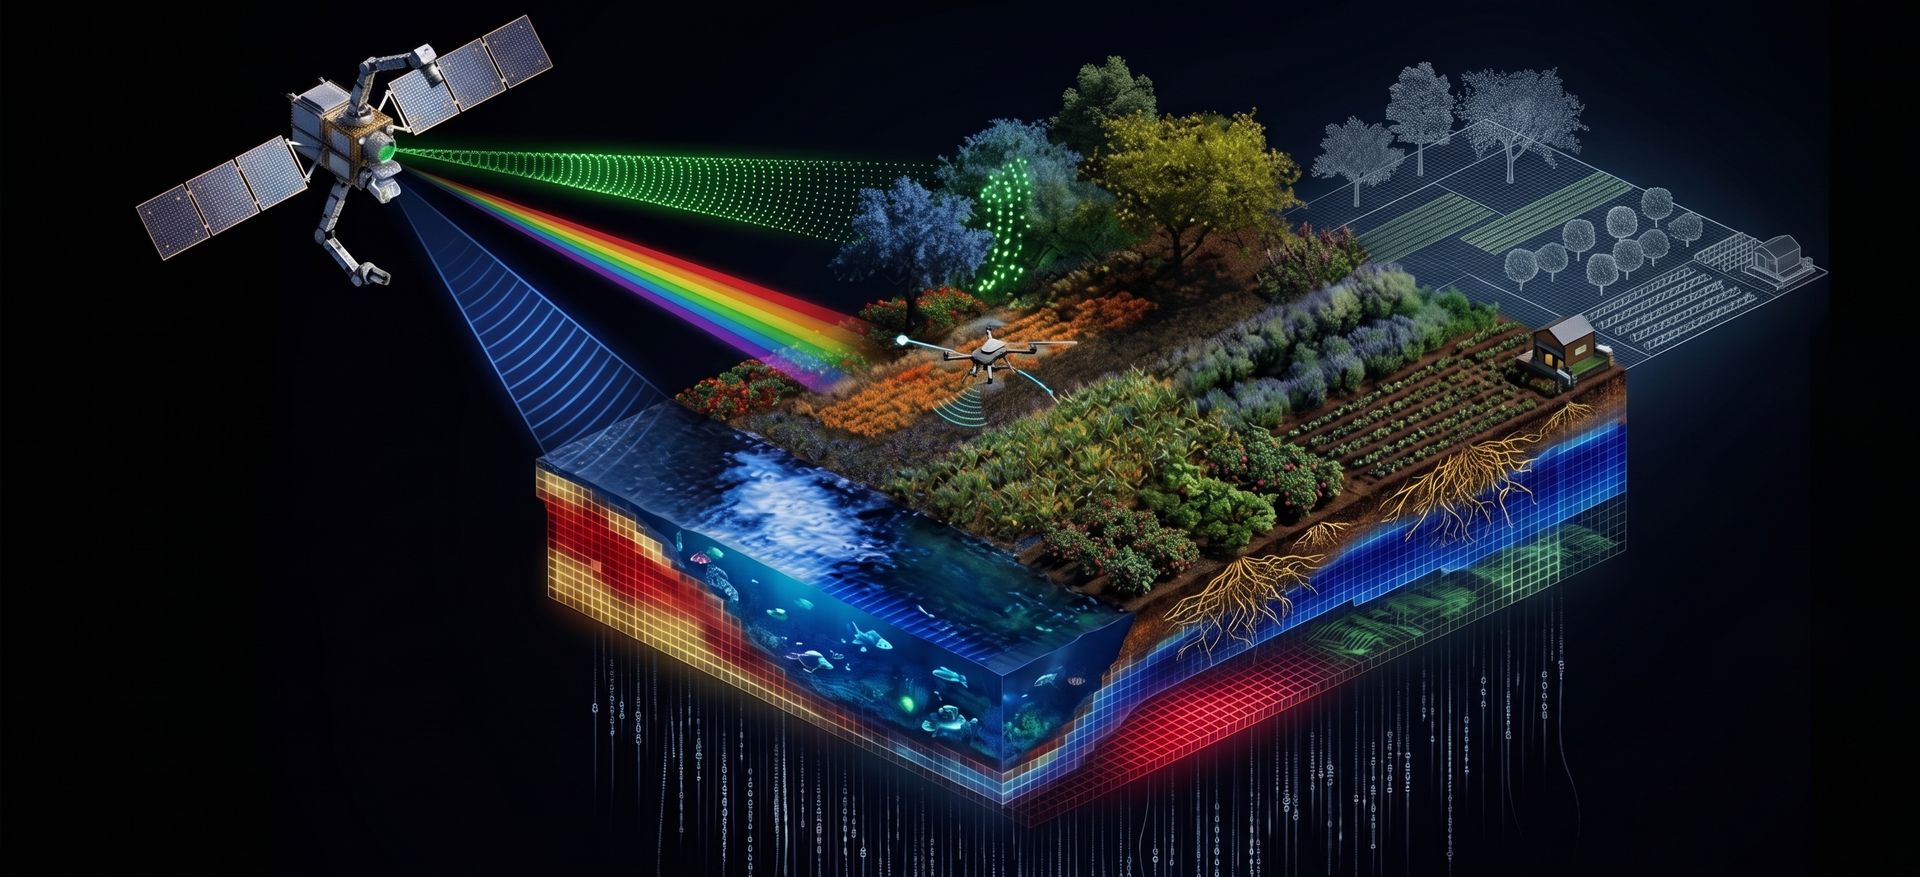
Axine turns satellite imagery into mineral maps, methane alerts and vegetation reports over any area on Earth, in hours instead of field seasons.

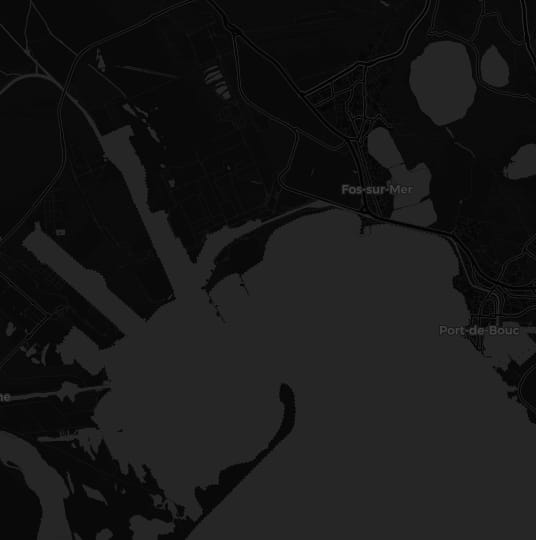
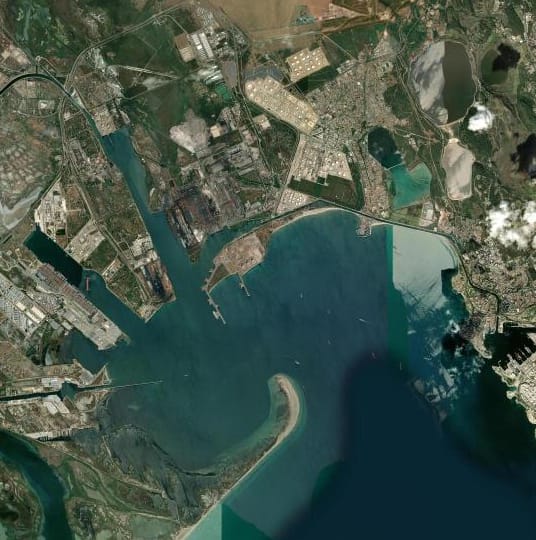
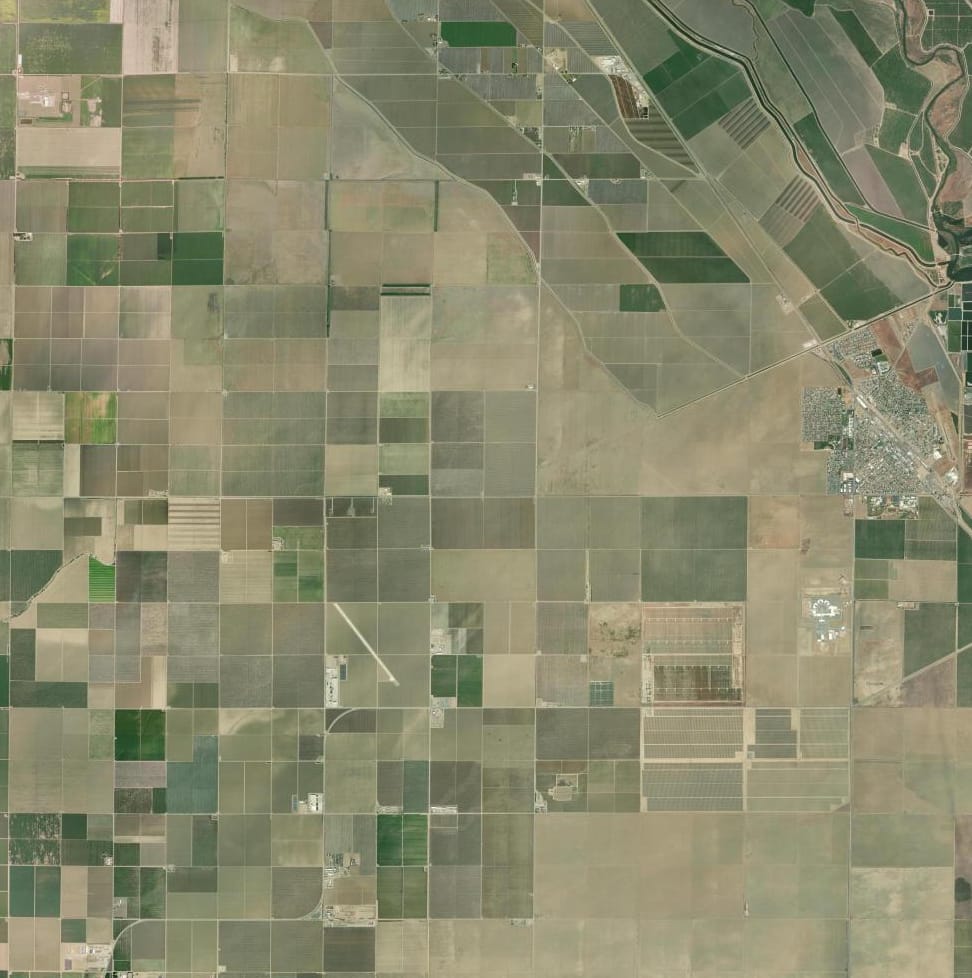
Fresh scenes over any square on Earth, found the moment you draw it.

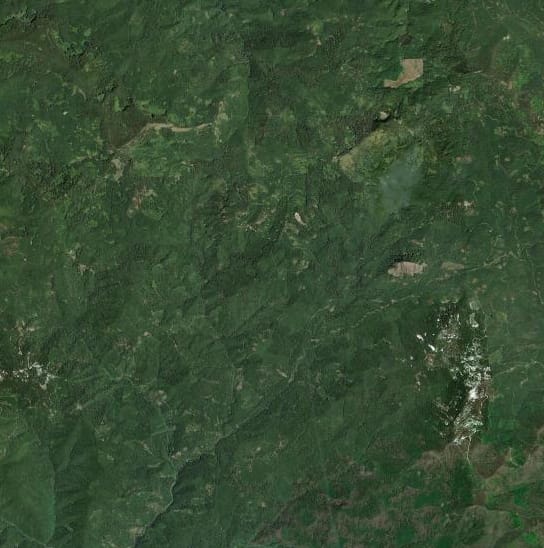
The same ground, painted as minerals, methane and moisture.

Finished layers in your workspace, ready for your GIS. Over your area, in minutes.
From first look to final map, in one place
Draw your area, pick a scene and go. Lisaris runs the analysis right where the data lives and hands you finished layers: an alteration map over a licence block, a methane screen around a terminal, a crop report across a season.
There is nothing to install and no training course to sit through. Results land in your workspace in minutes and export straight into ArcGIS, QGIS or your own models.


Basemaps © OpenStreetMap contributors, © CARTO, © Esri
Or simply ask
Lisaris is also an agent. Tell it what you need in plain language and it handles the rest, then lets you know when the work is done.
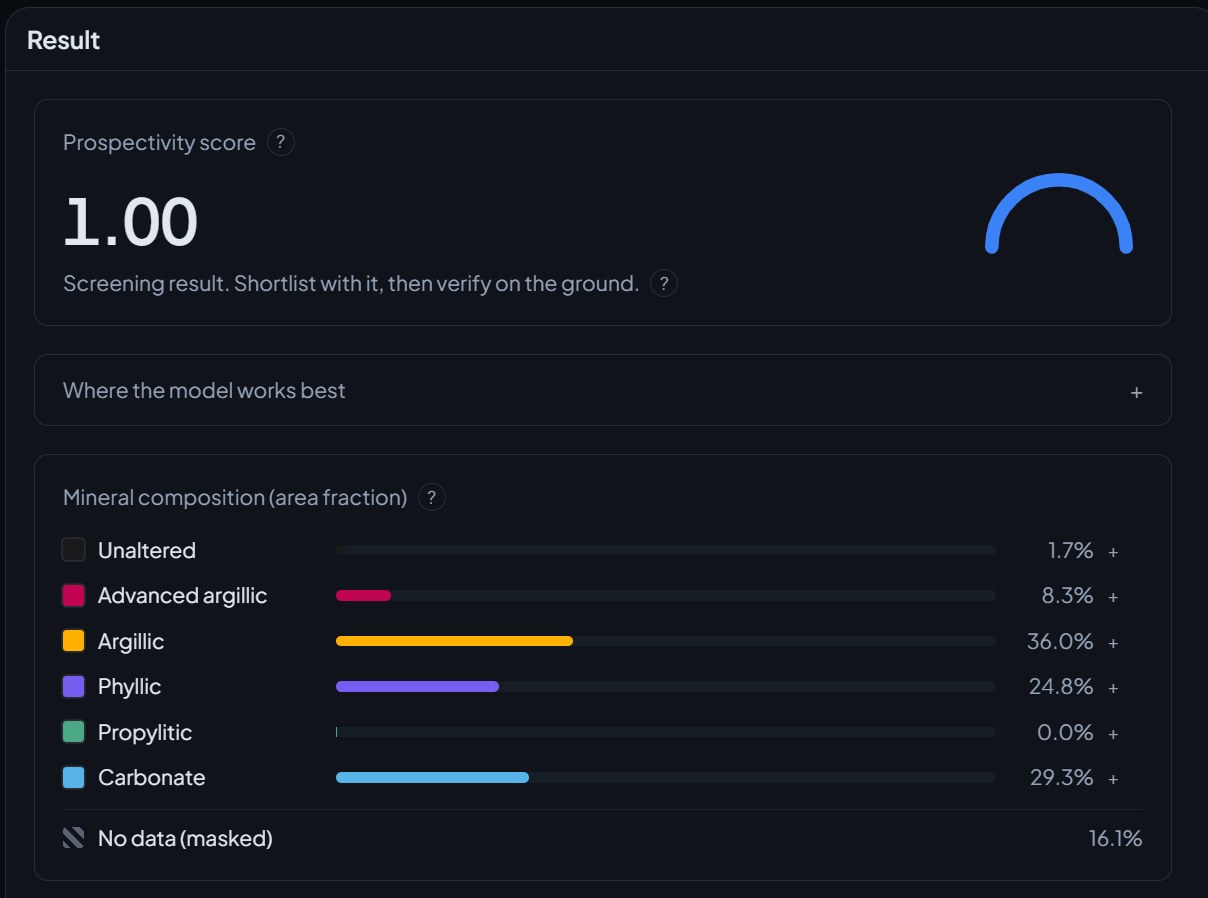
Select an AOI as a 100 km² square centred on 24.21°S, 69.08°W, run alteration mineral mapping and district prospectivity scoring, and notify me when the layers are ready.
Done. Your AOI is a 10 km × 10 km square centred on 24.21°S, 69.08°W in the Antofagasta region of northern Chile, in the Cordillera de Domeyko on the eastern margin of the Atacama Desert, northwest of the Salar de Punta Negra and about 150 km southeast of Antofagasta. Elevation runs roughly 2,600 to 3,400 m. The ground is arid with near-continuous rock exposure and almost no vegetation, which is close to ideal for surface mineralogy.
I searched the archive and found 14 usable scenes over the square. Alteration mineral mapping is queued first so the prospectivity score can read its output, and both layers will land in your workspace within the hour.
One thing worth knowing while that runs: your square sits on the same structural corridor that hosts the Escondida cluster a few kilometres south, and the regional grain through the
Where Lisaris goes to work
Every sector asks different questions of the same imagery. Lisaris comes ready for yours.
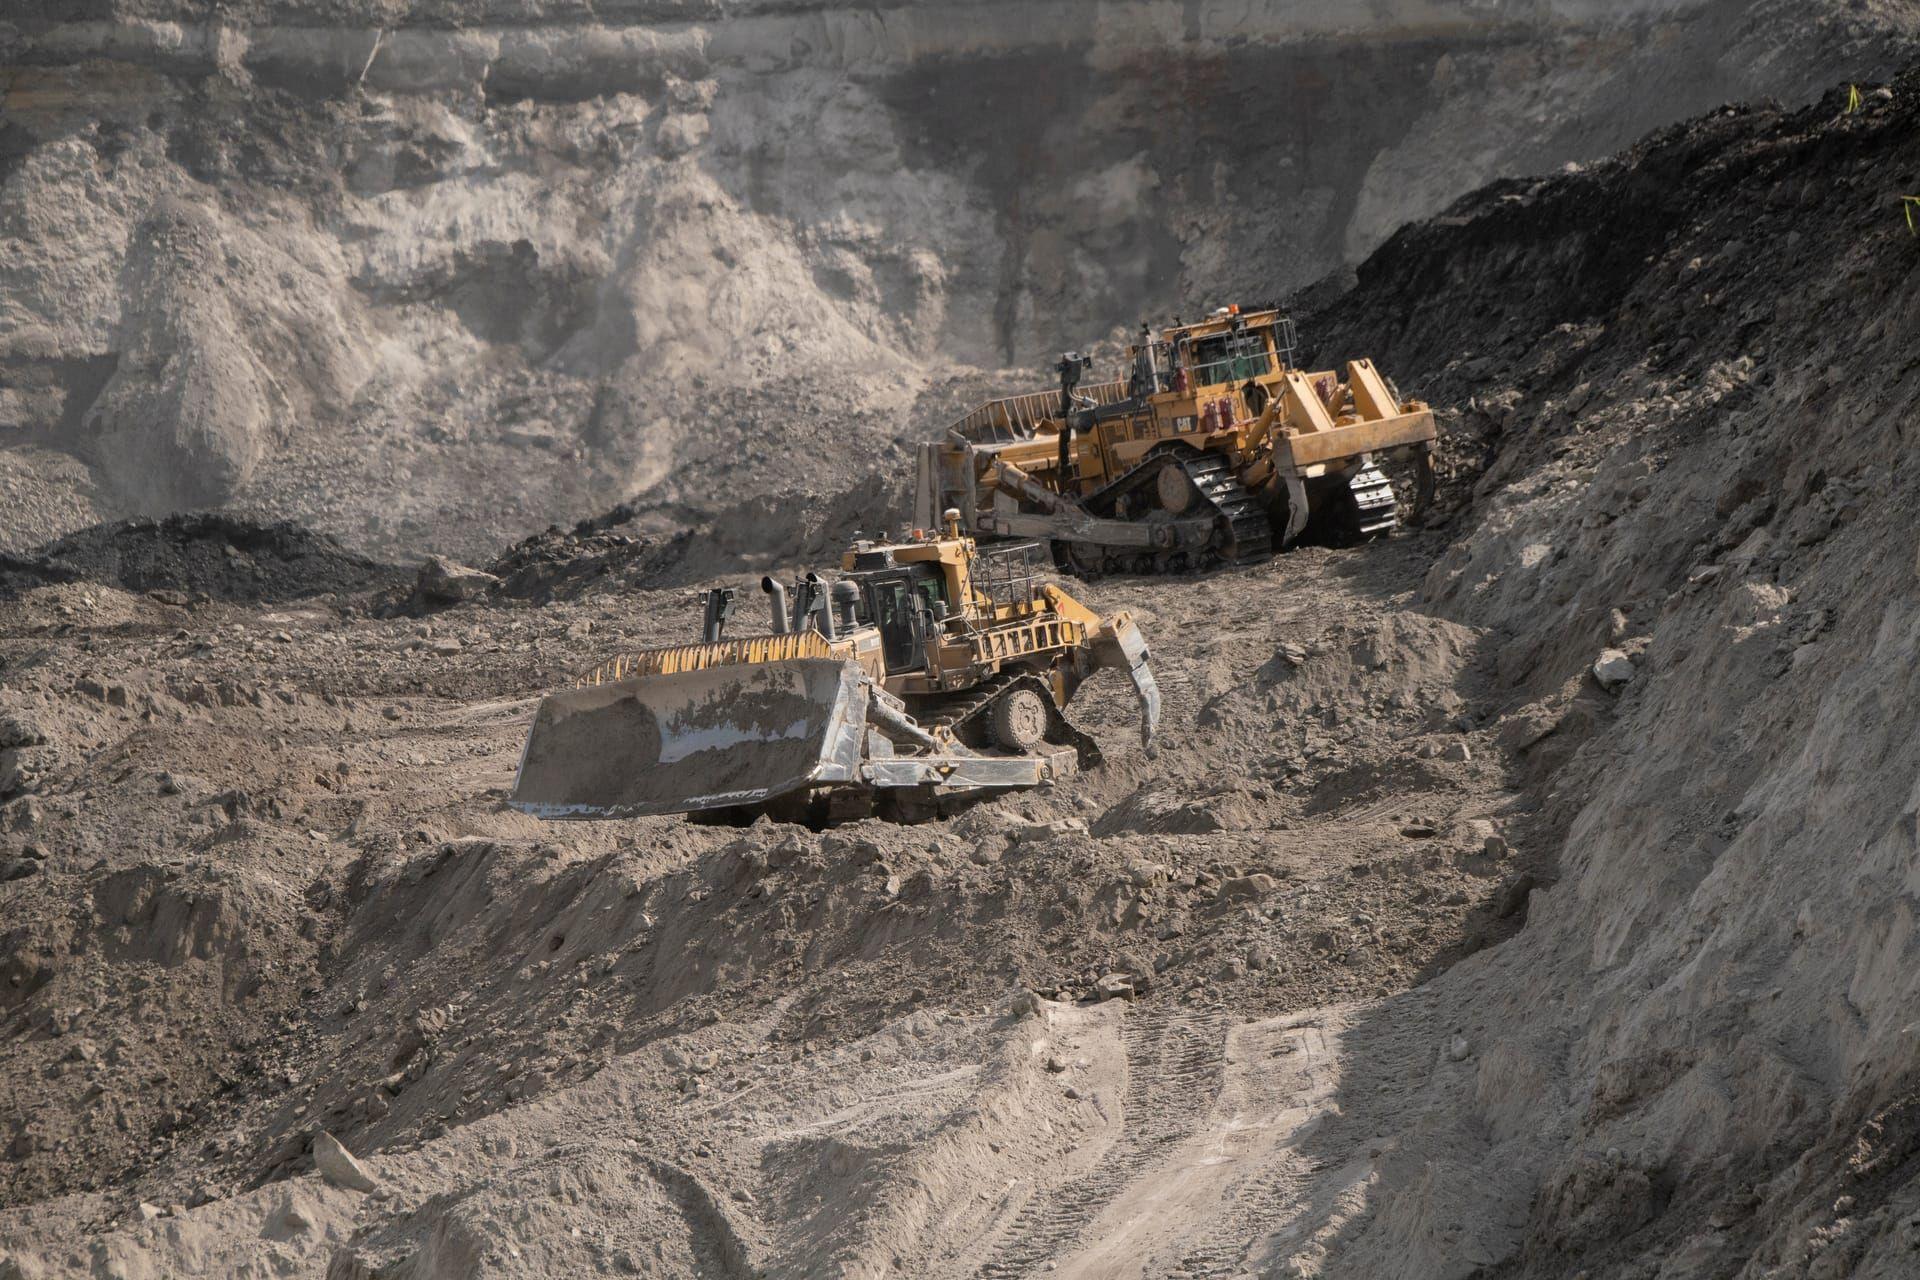
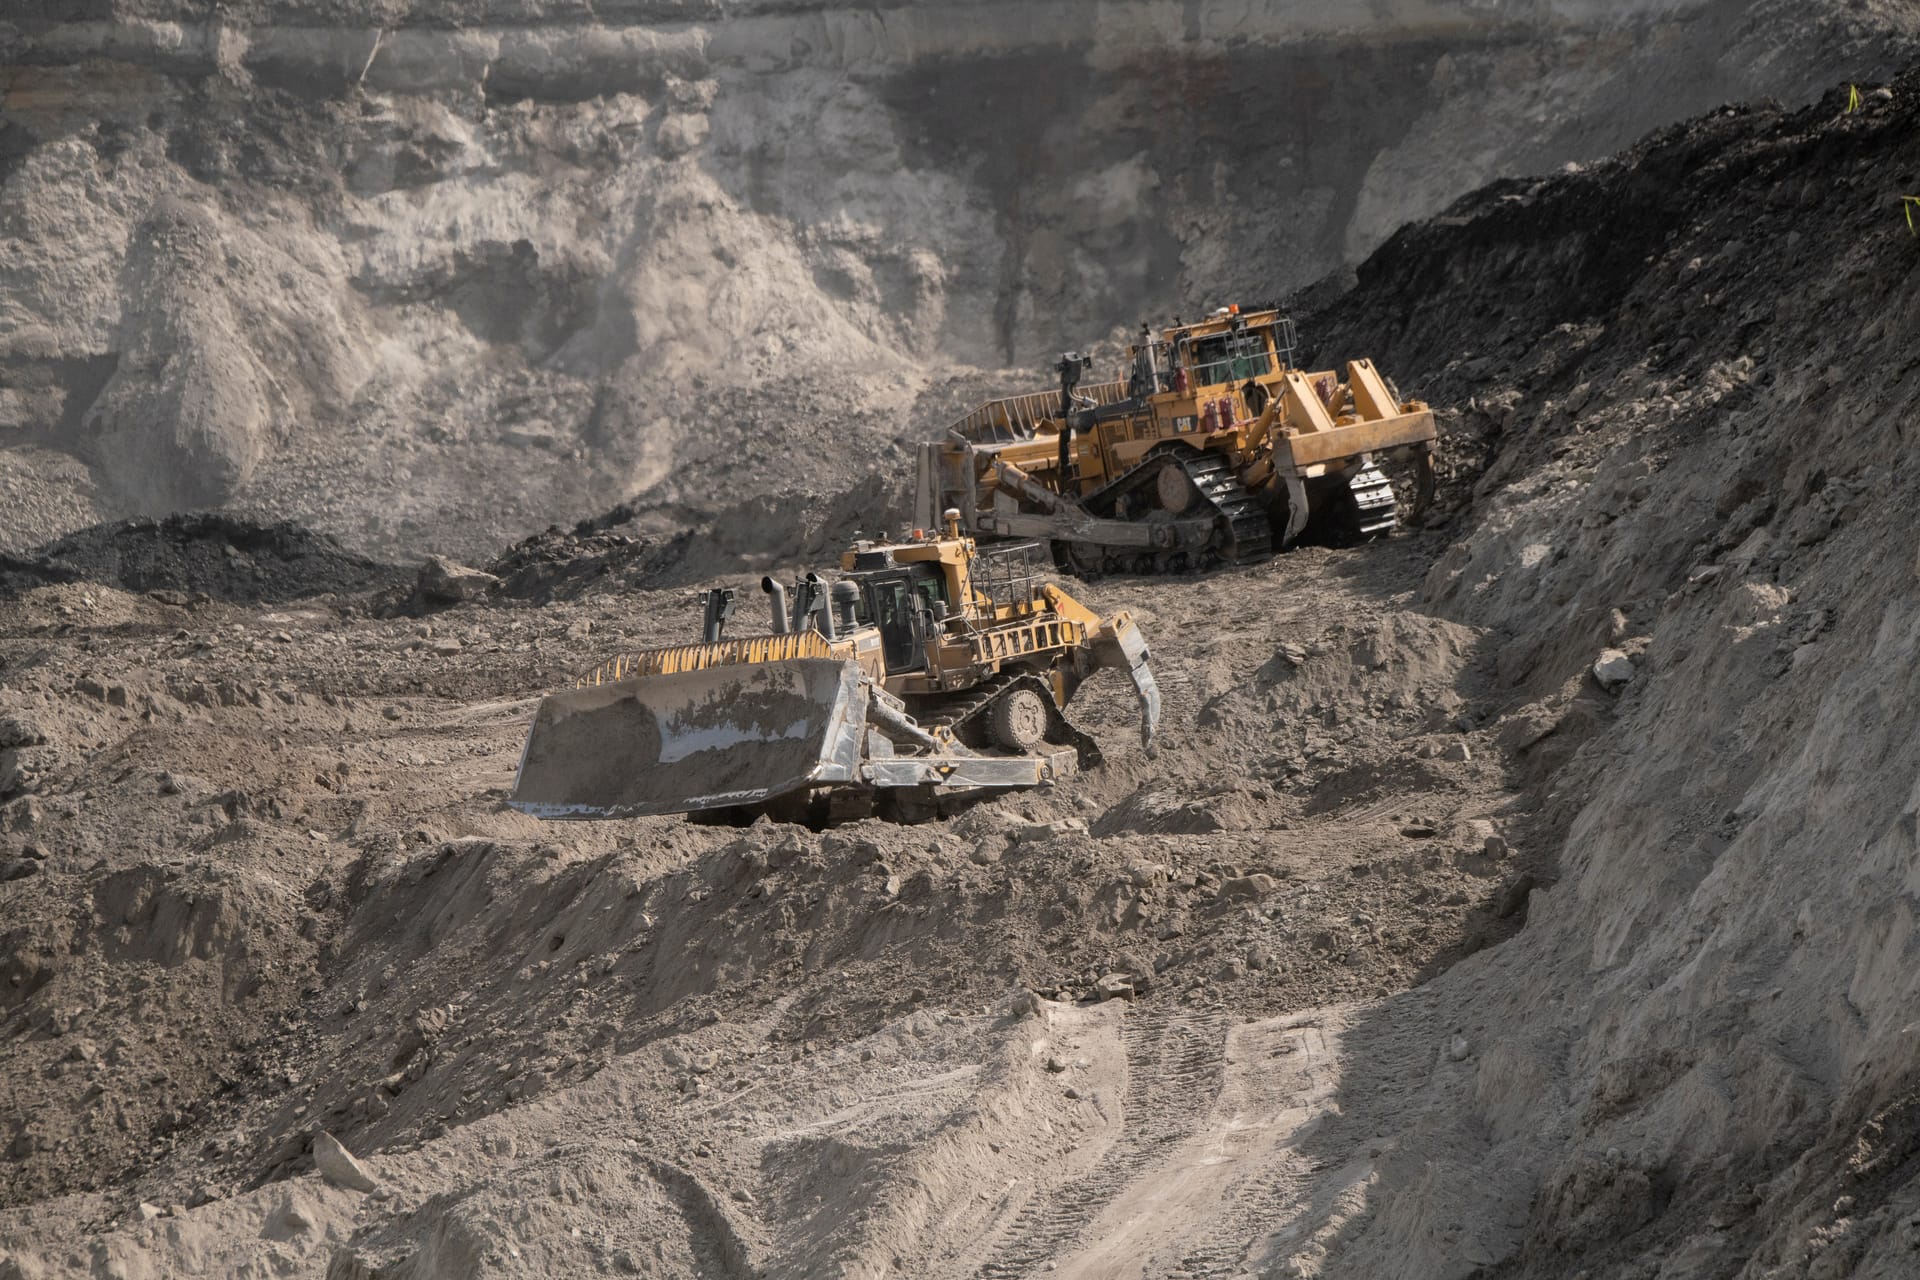
Mineral exploration
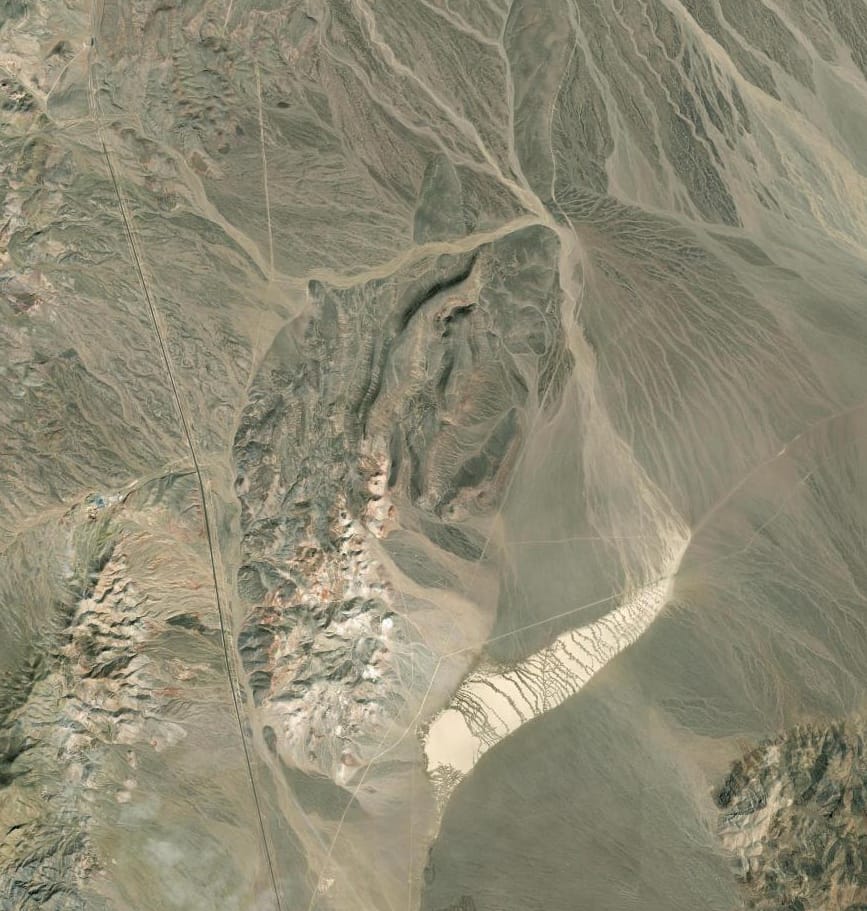
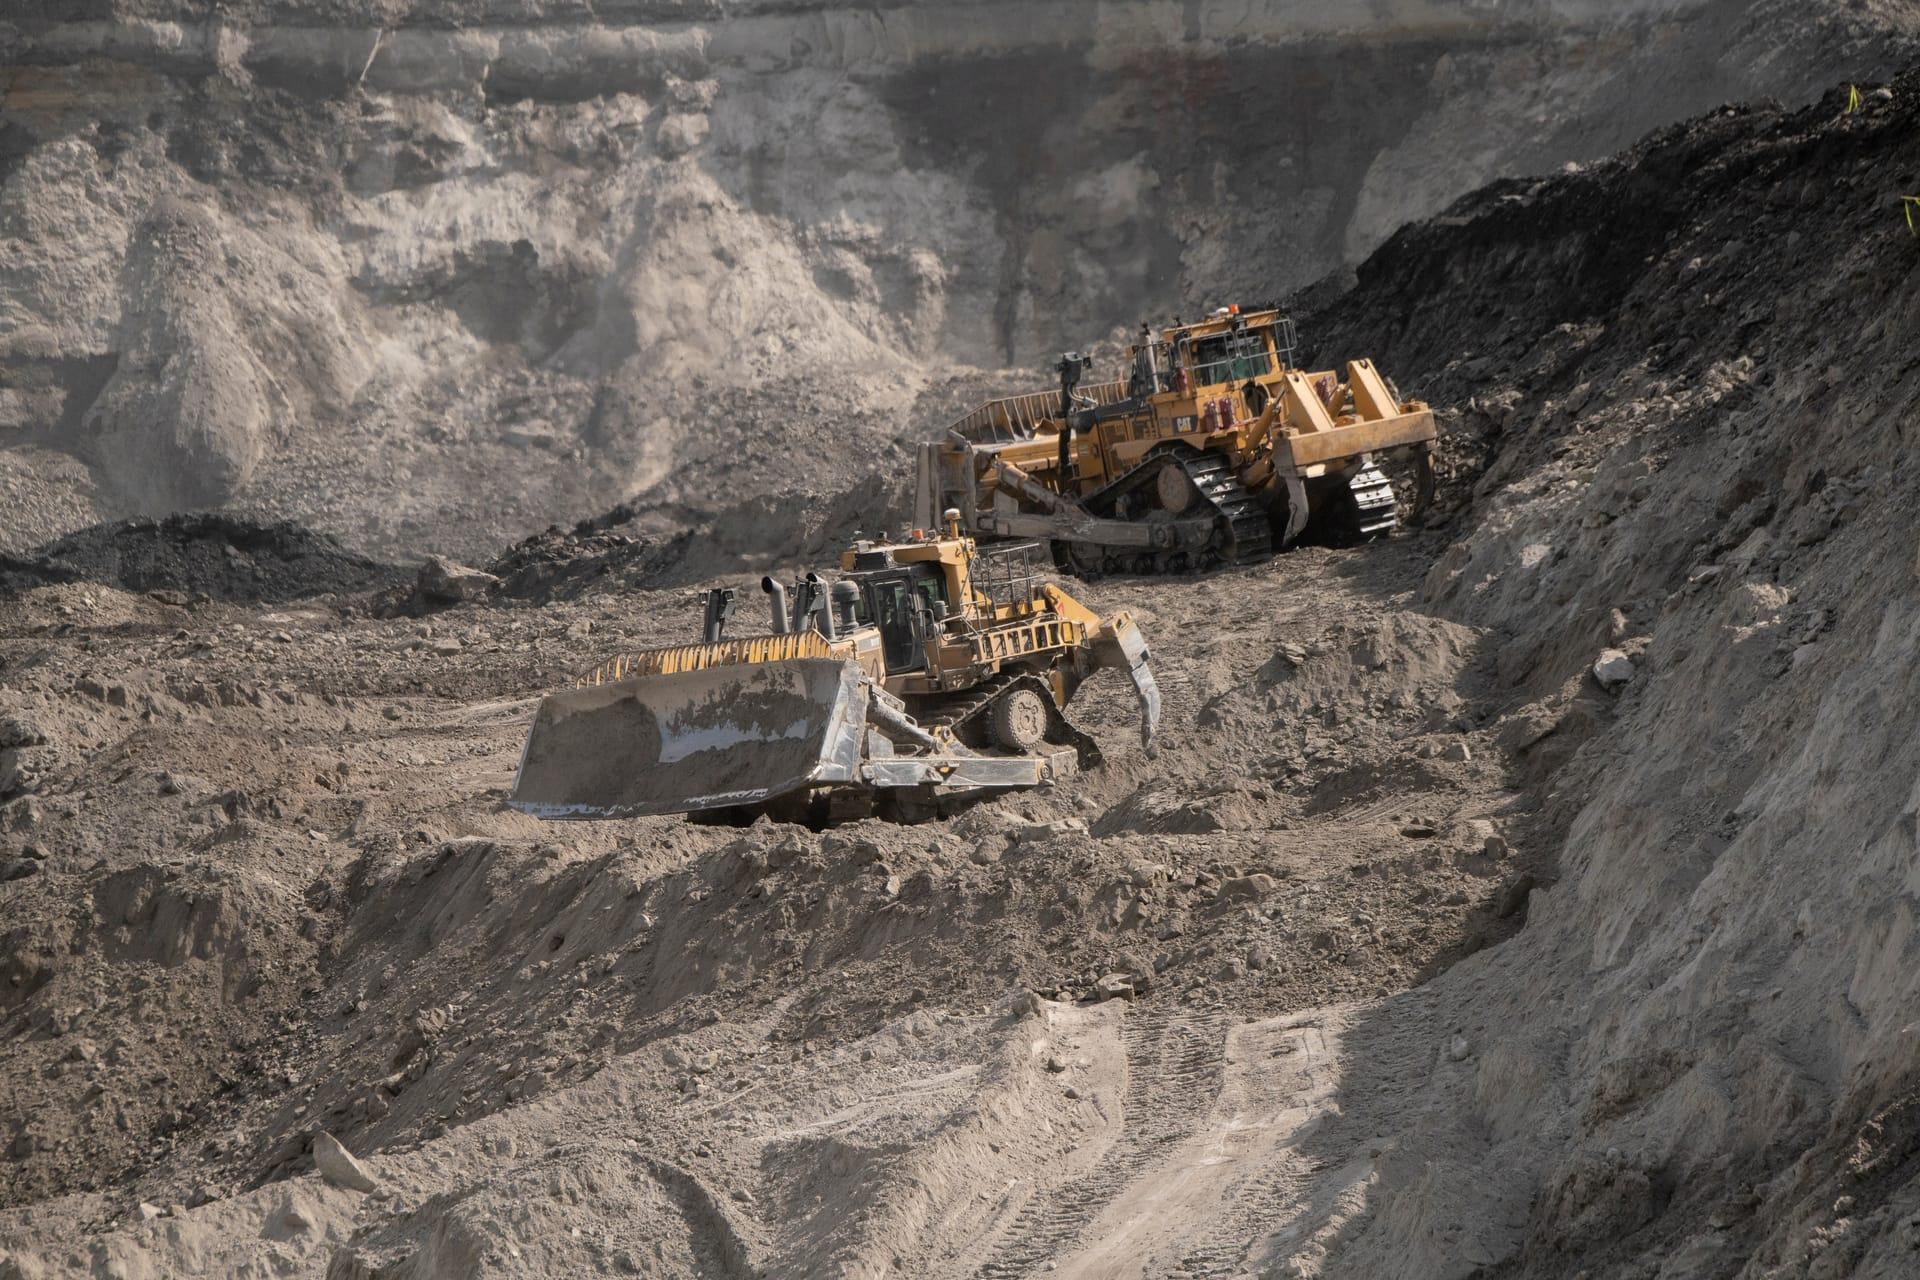
Map alteration and screen districts across any licence area before the first crew is scheduled.
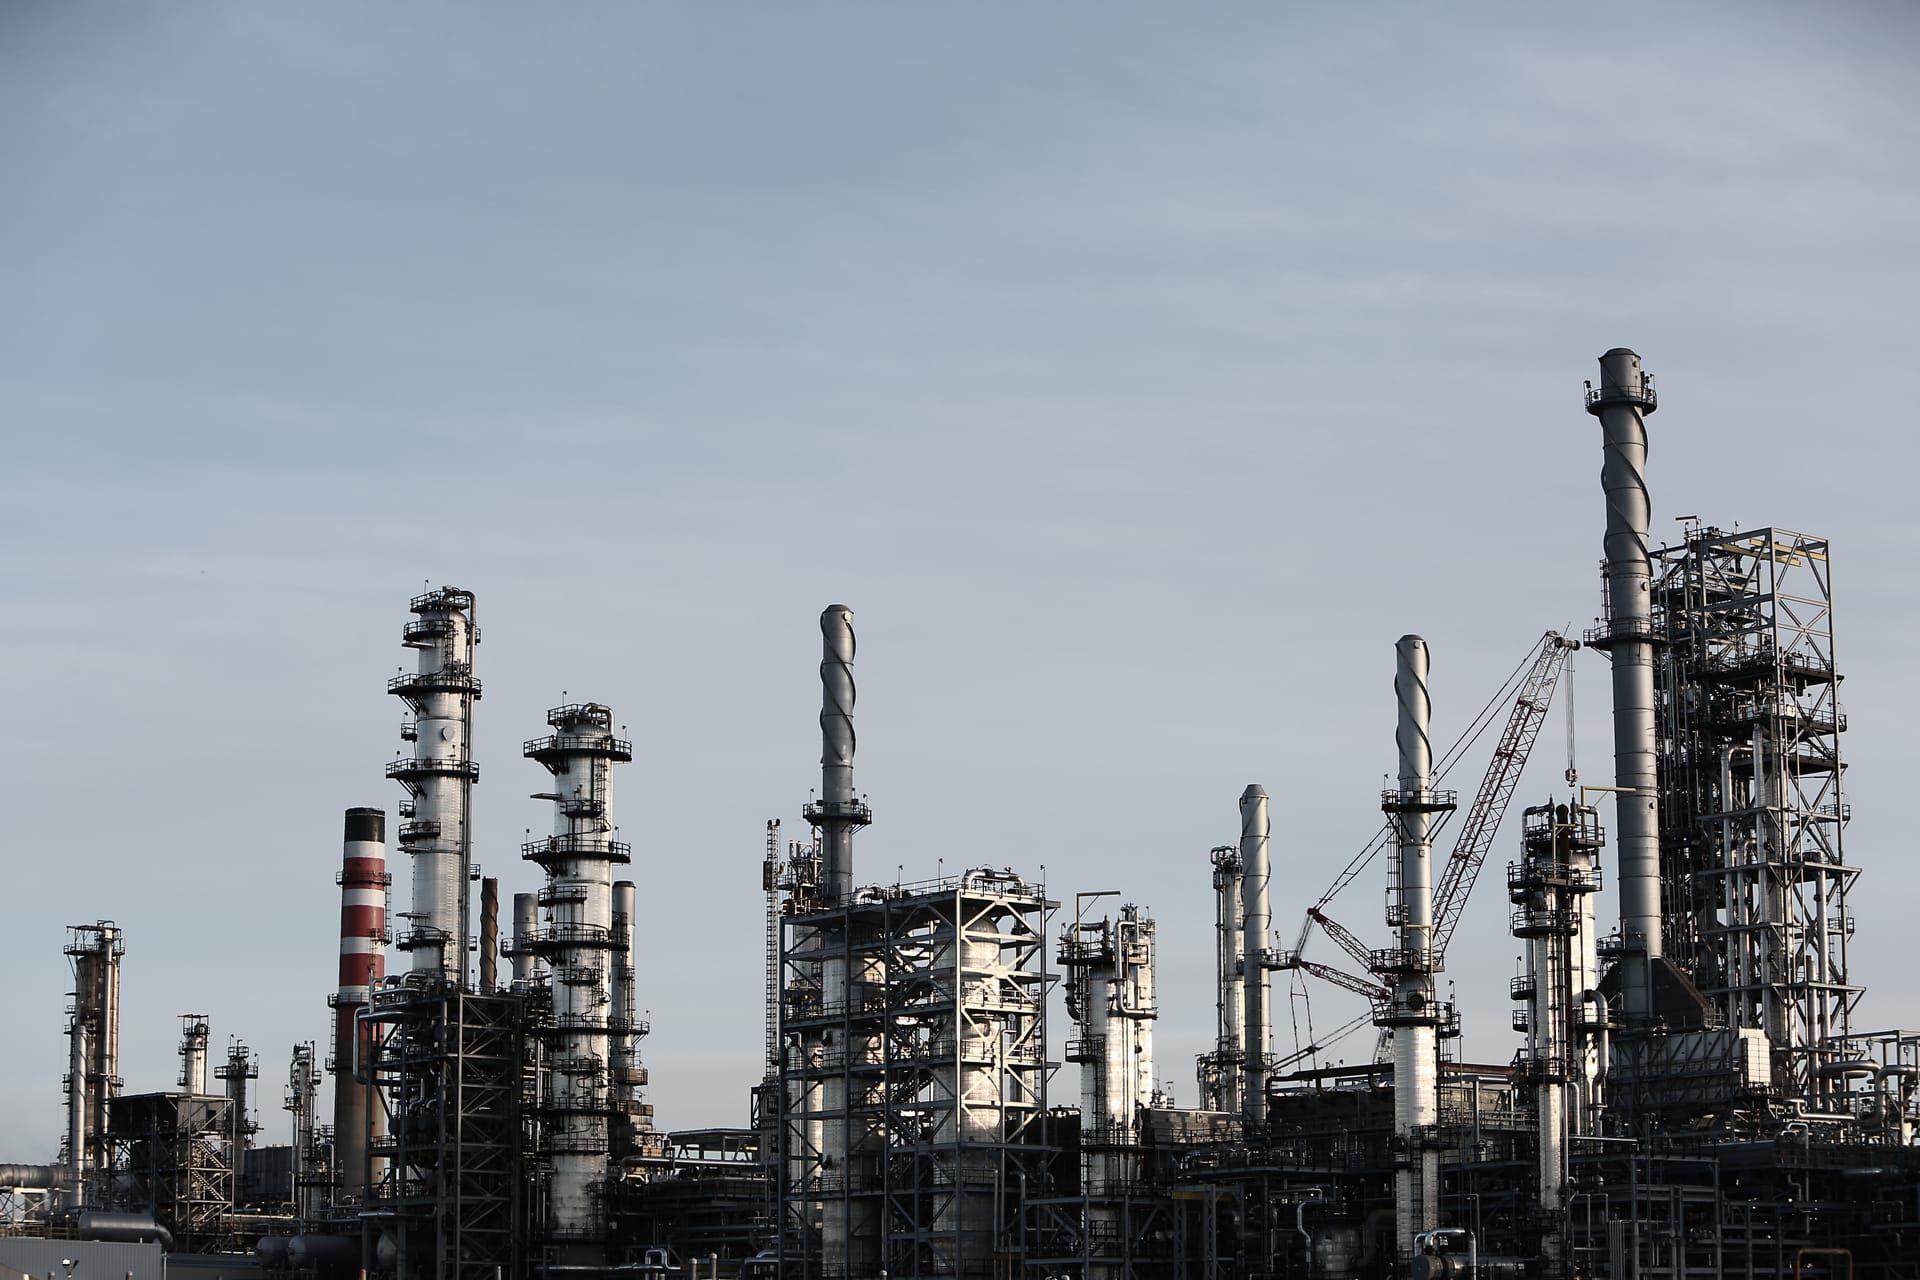
Energy
Watch for methane around wells, pipelines and terminals, and document what you find.
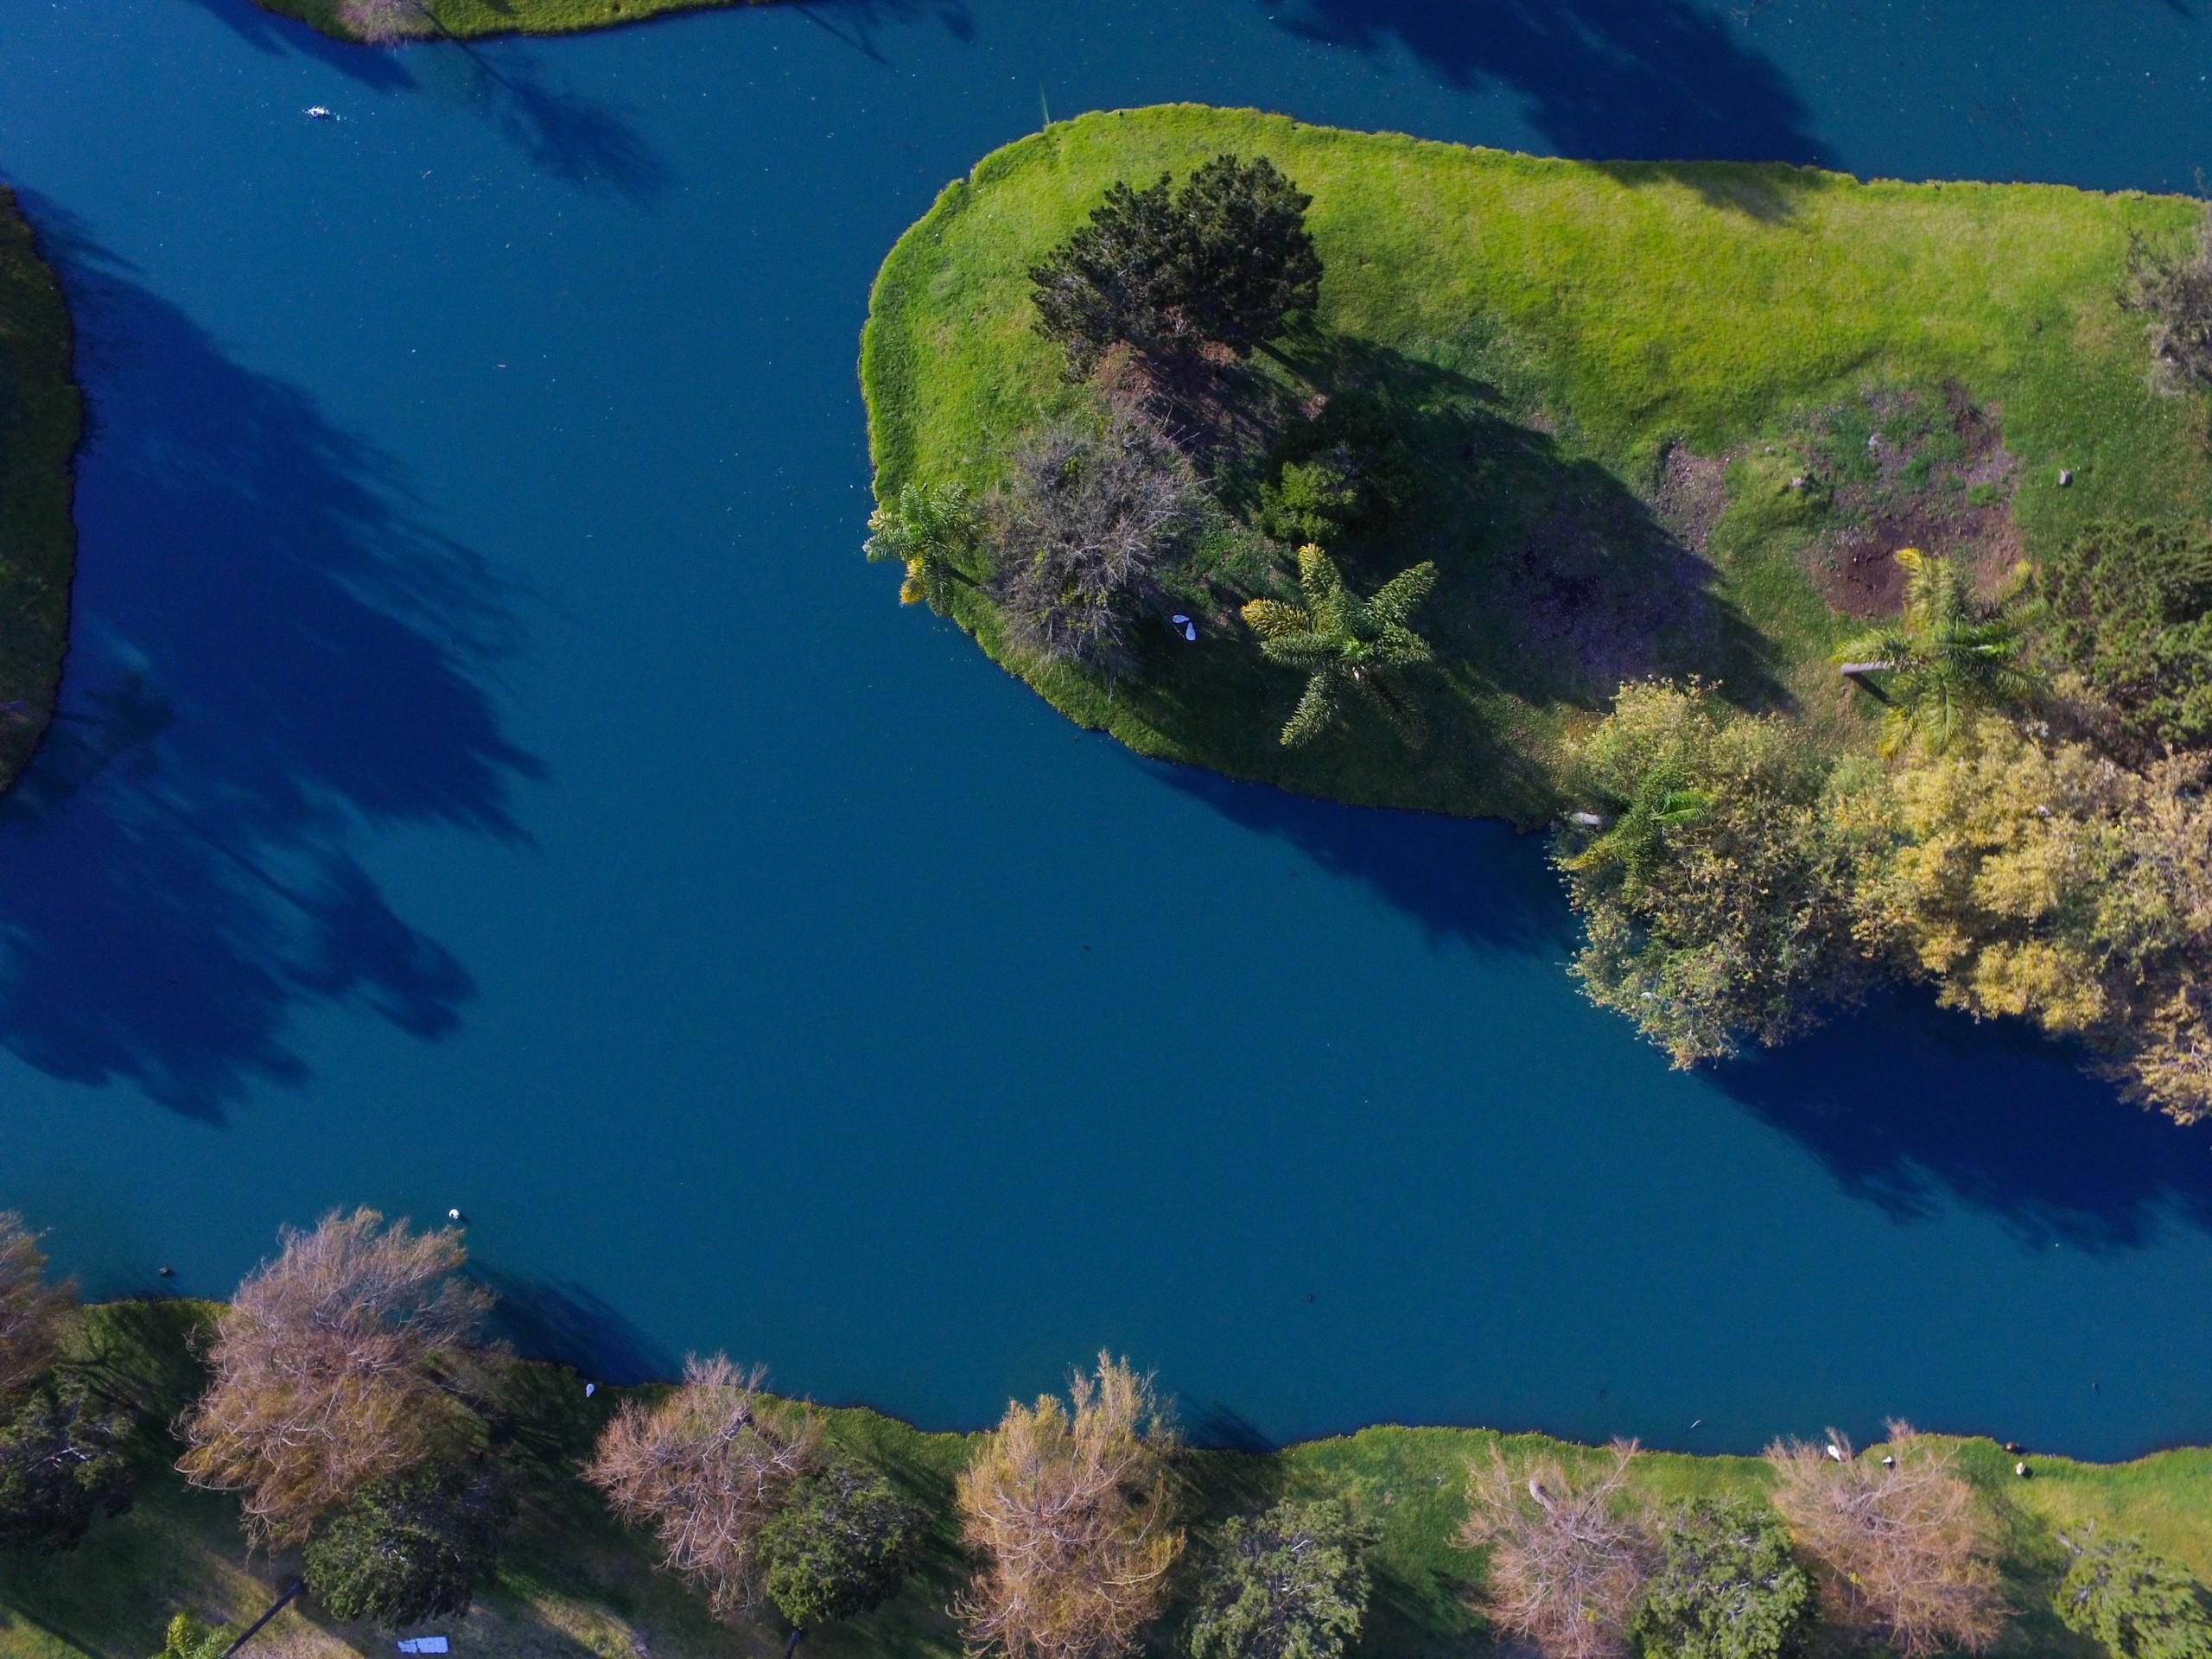
Water quality
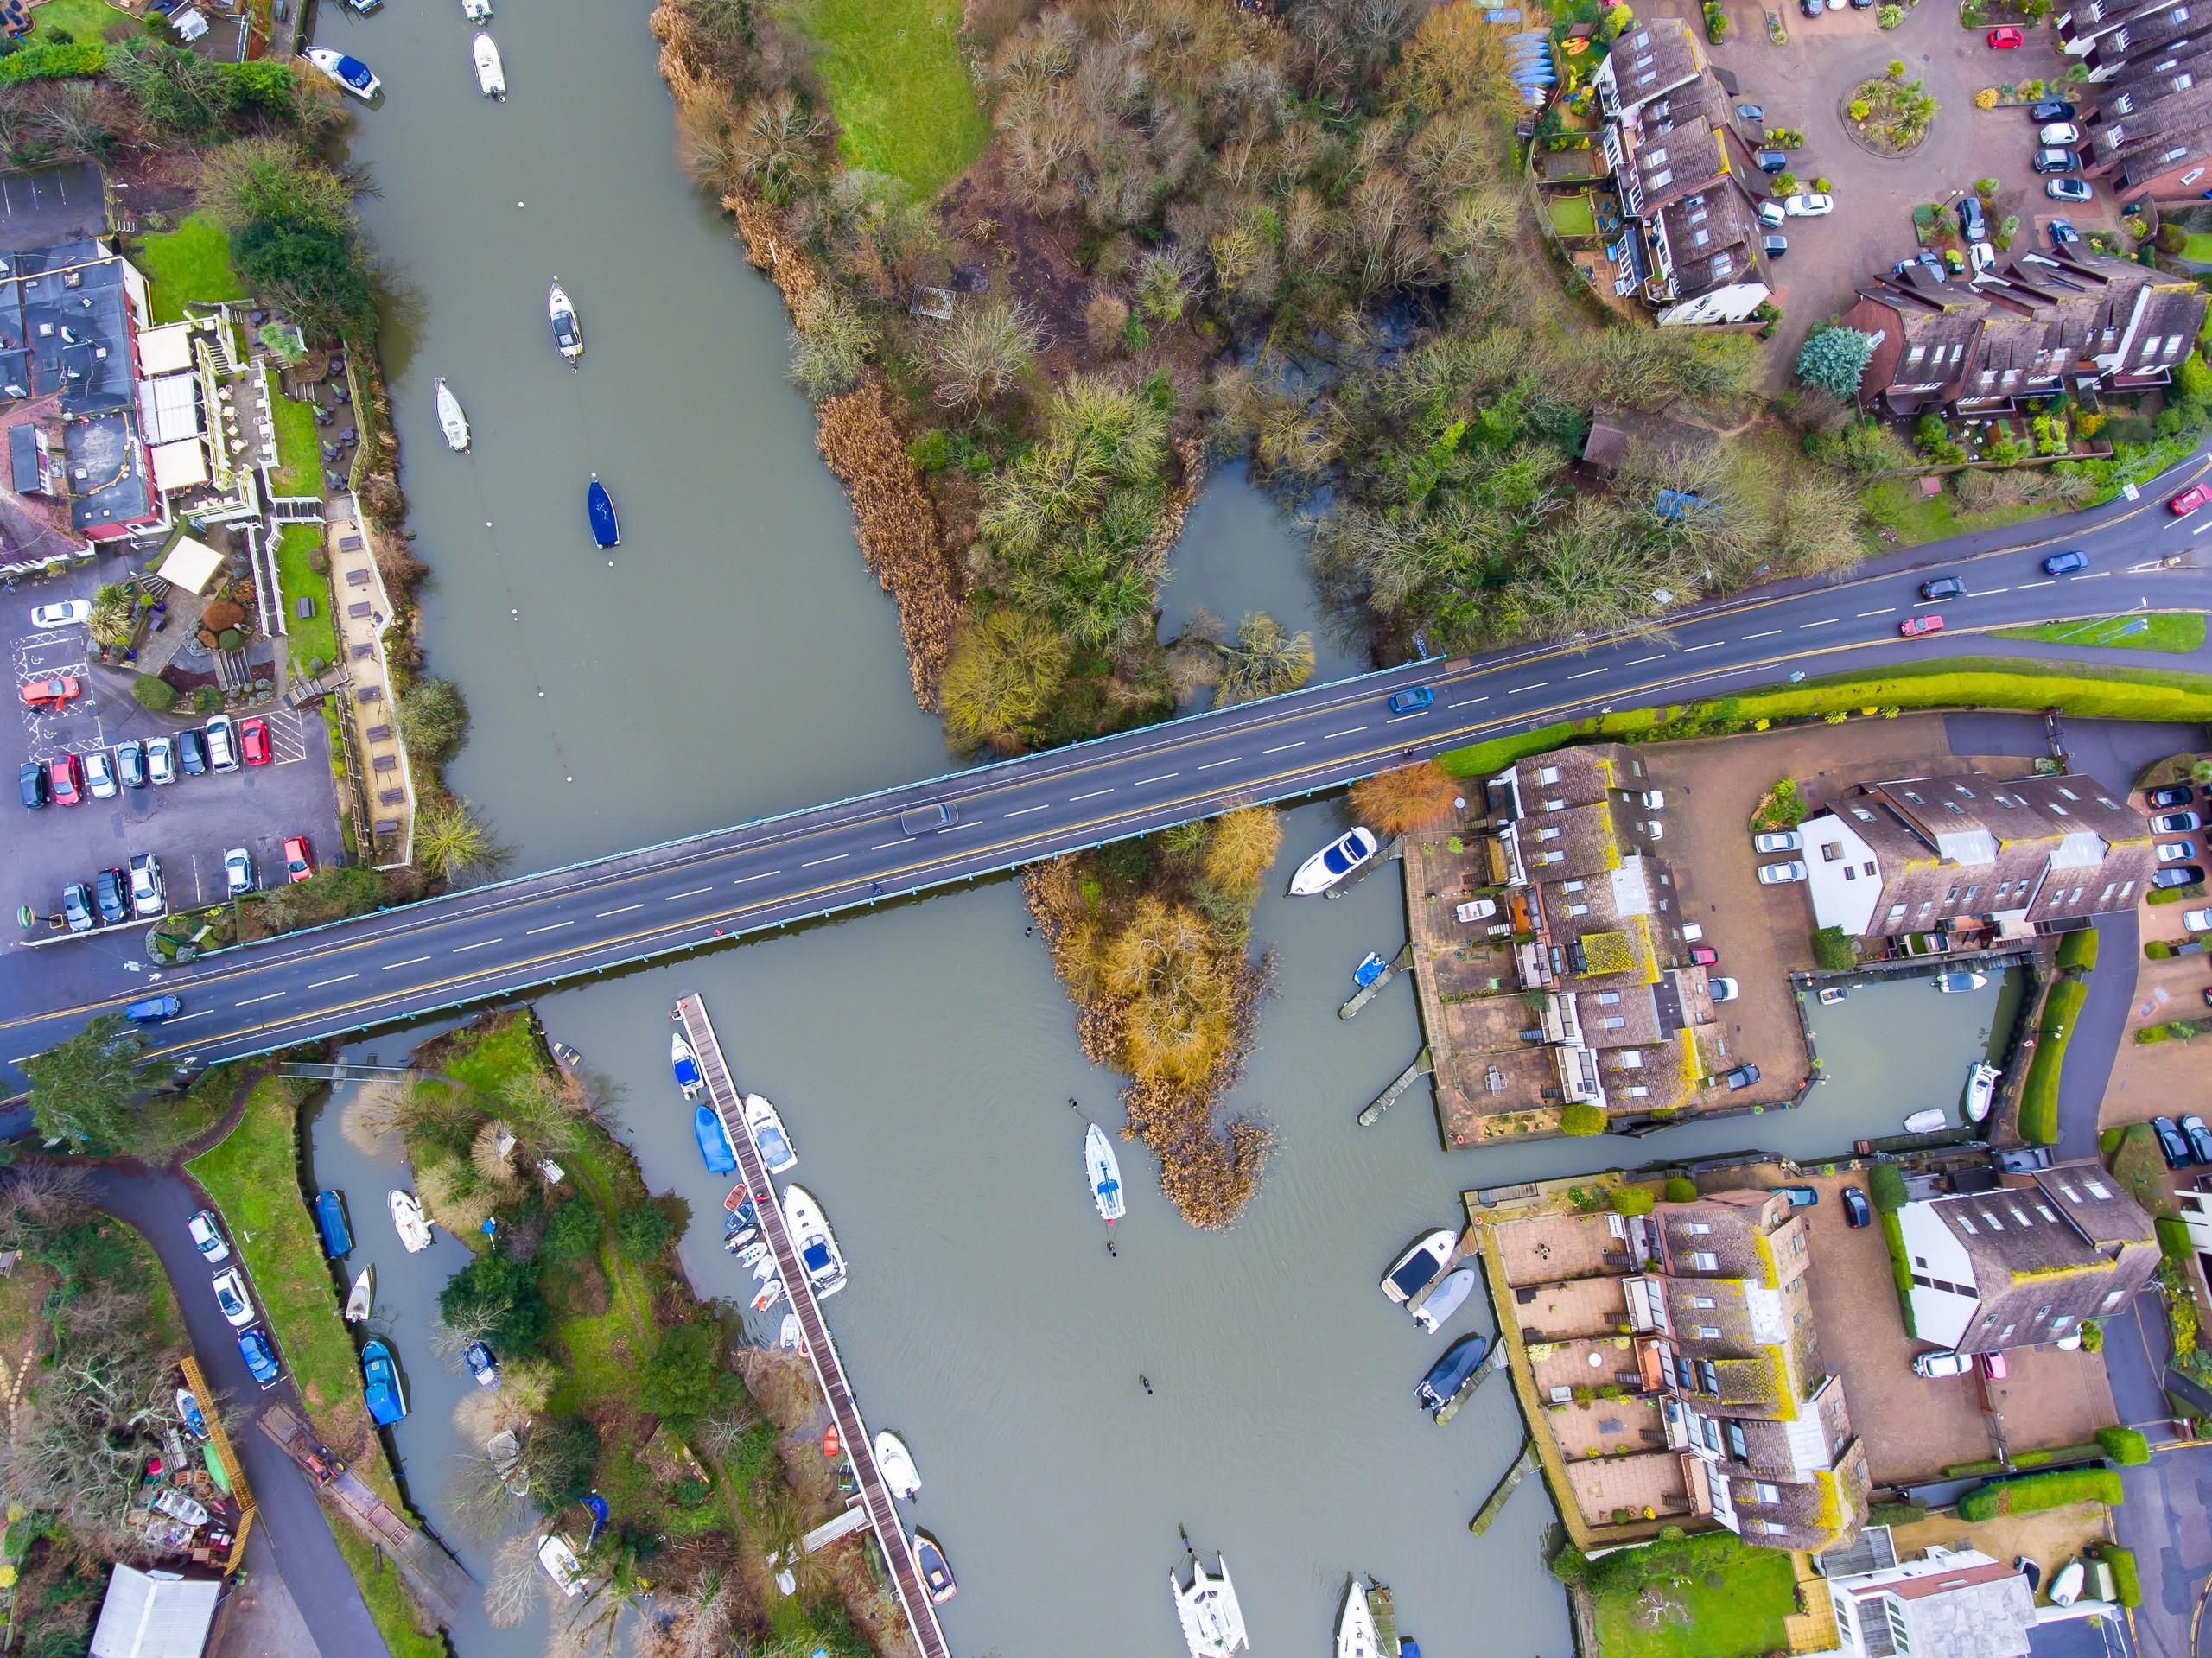
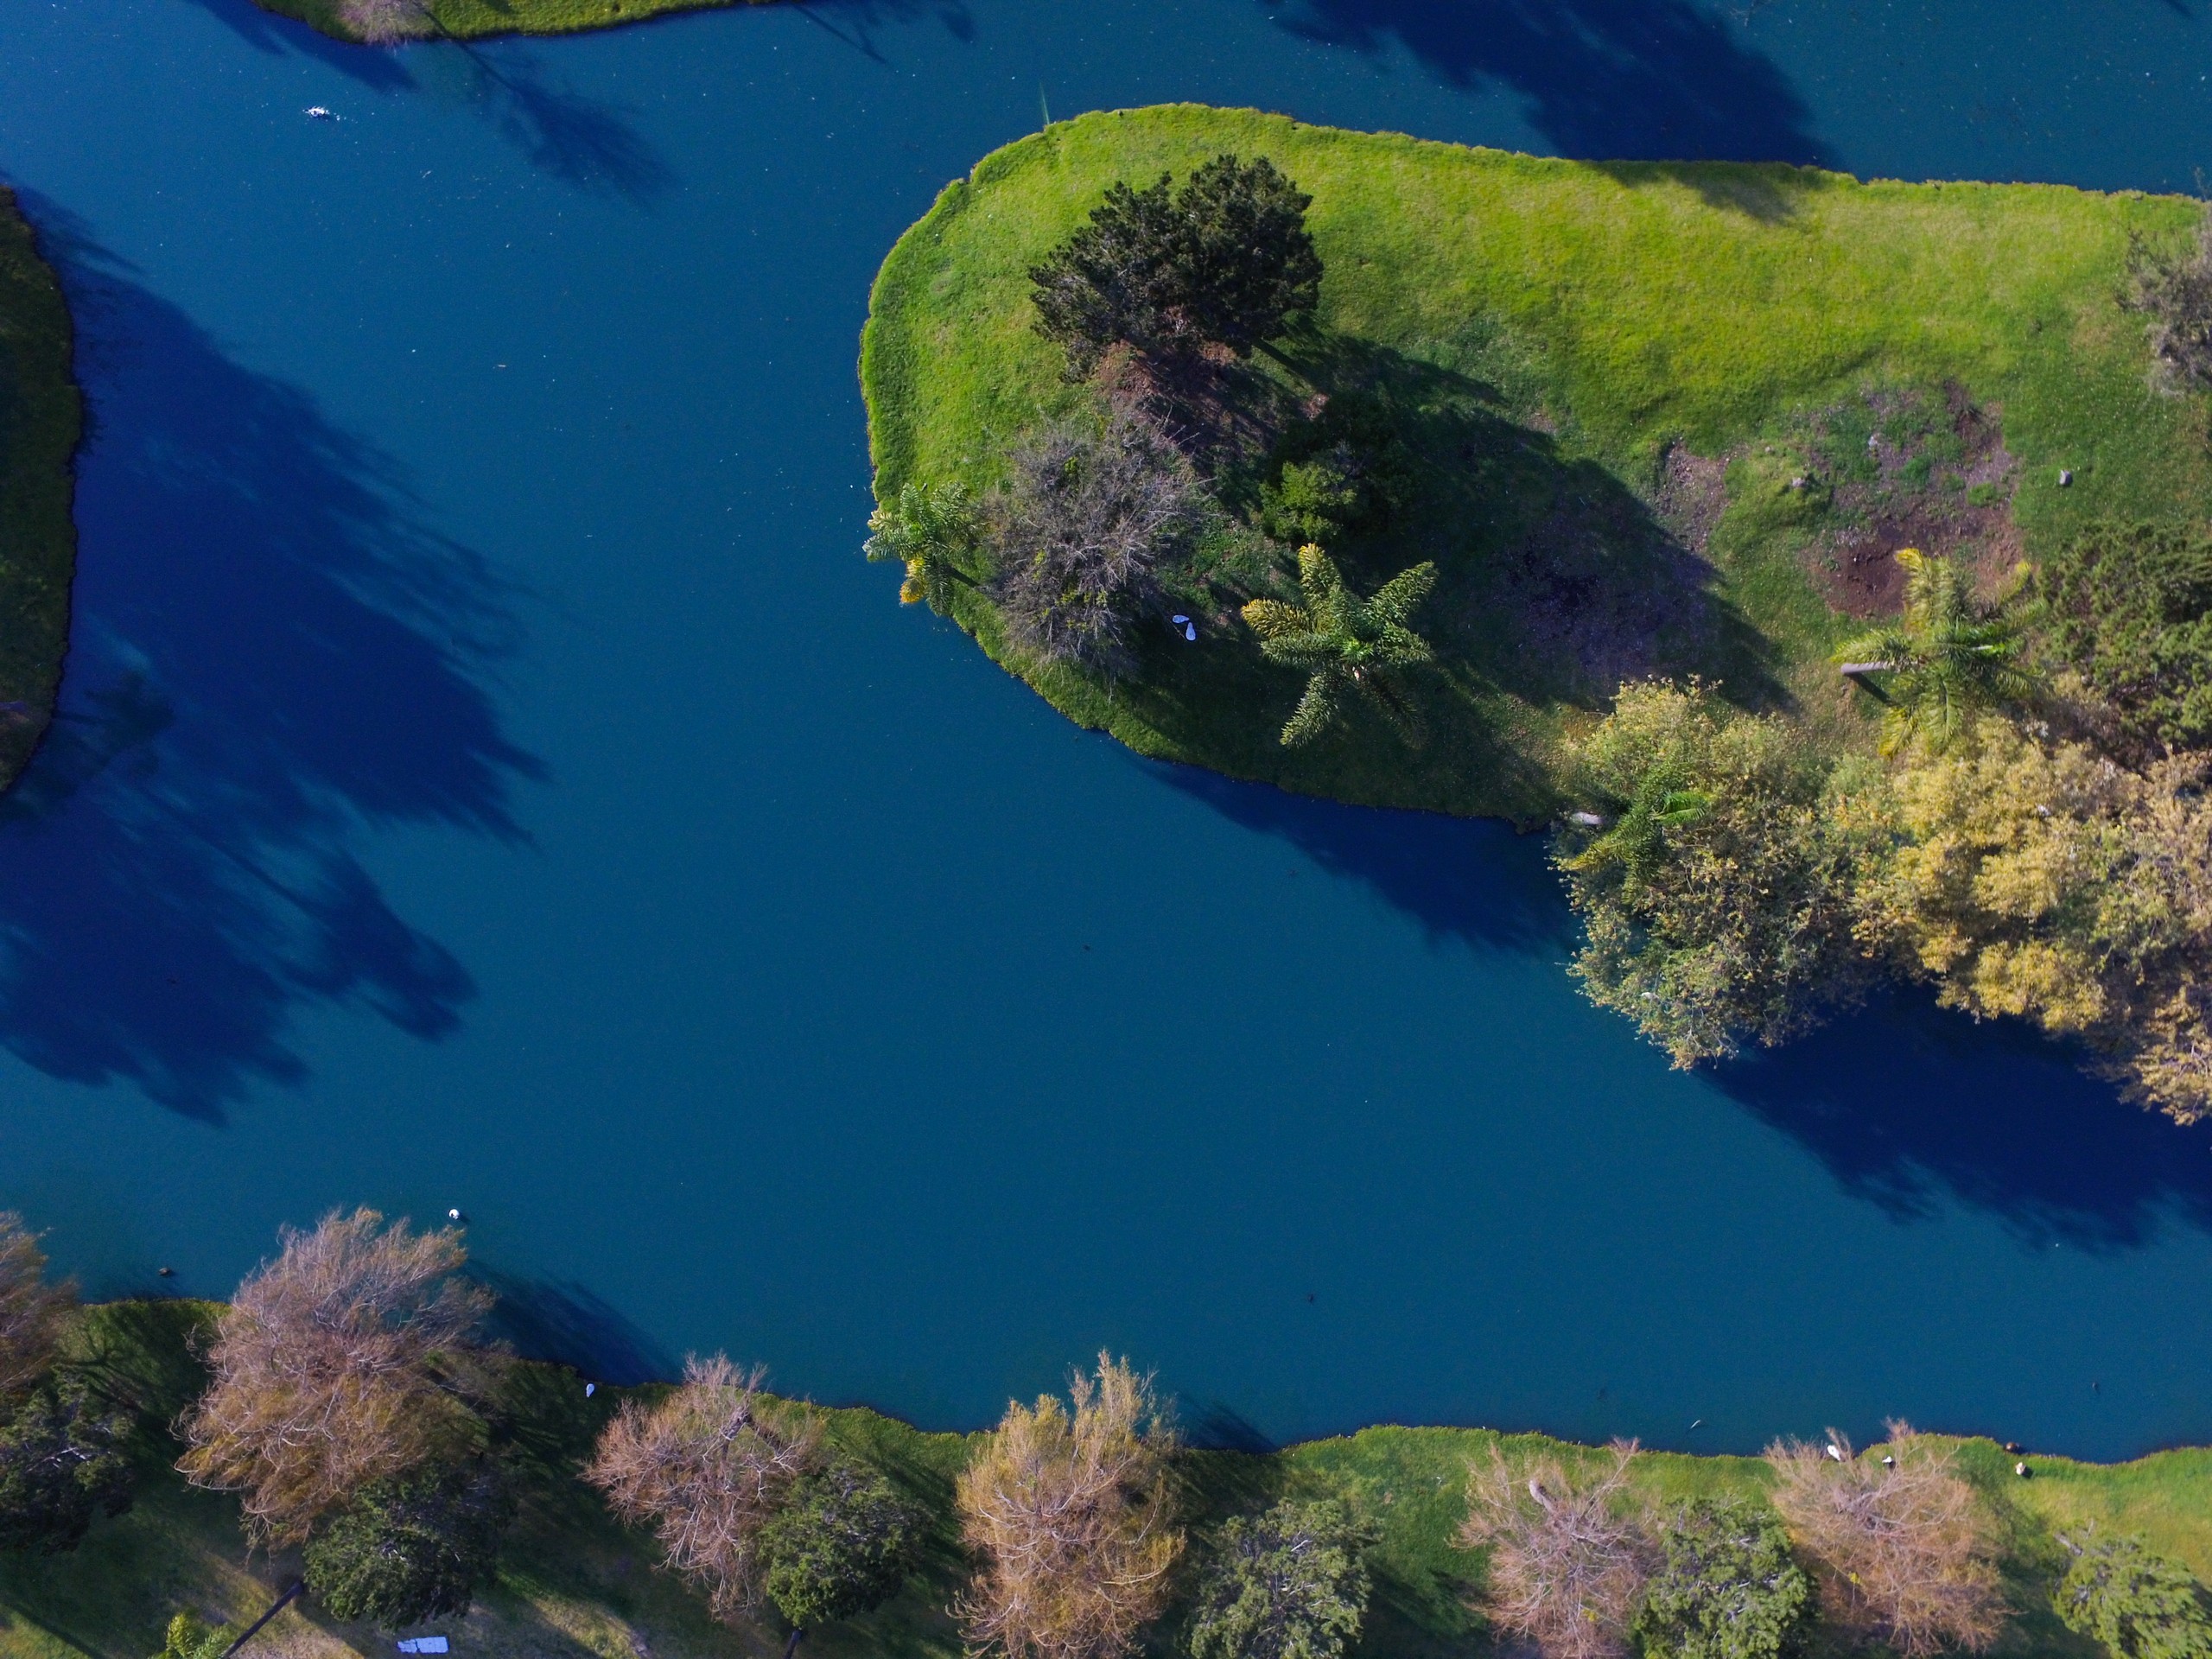
Track chlorophyll, turbidity and algal risk across lakes, reservoirs and coastlines.
Forestry
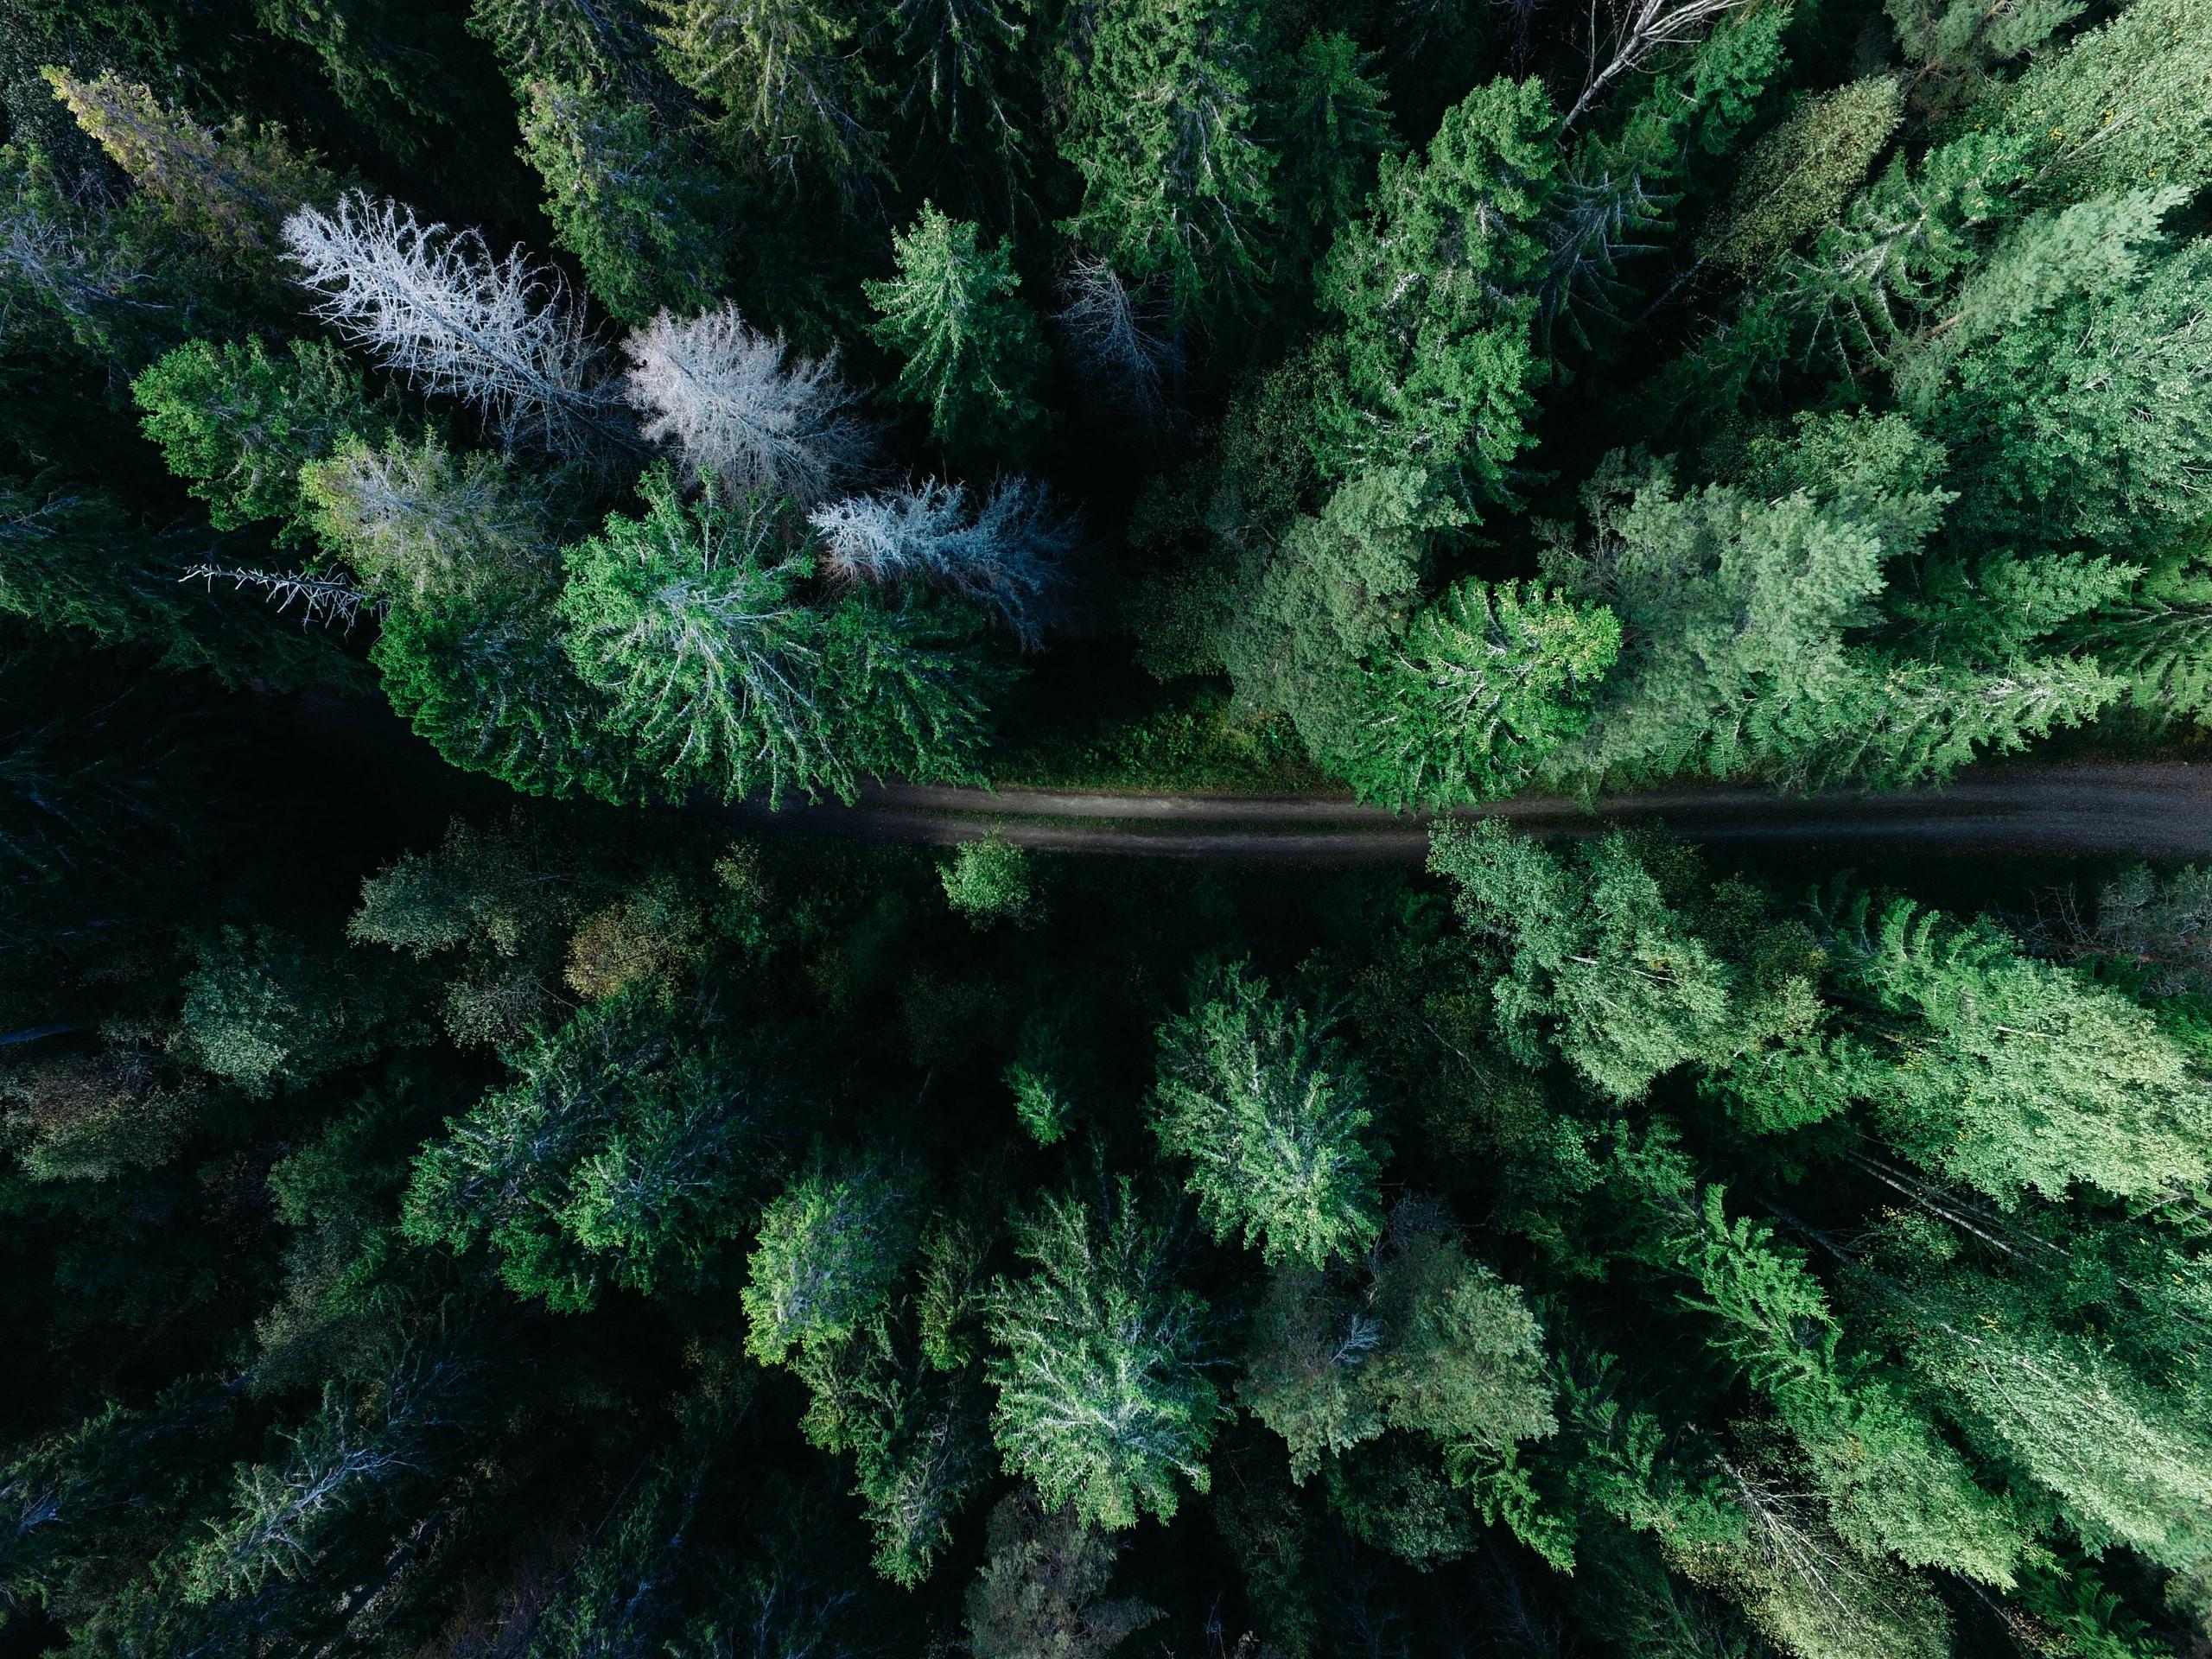
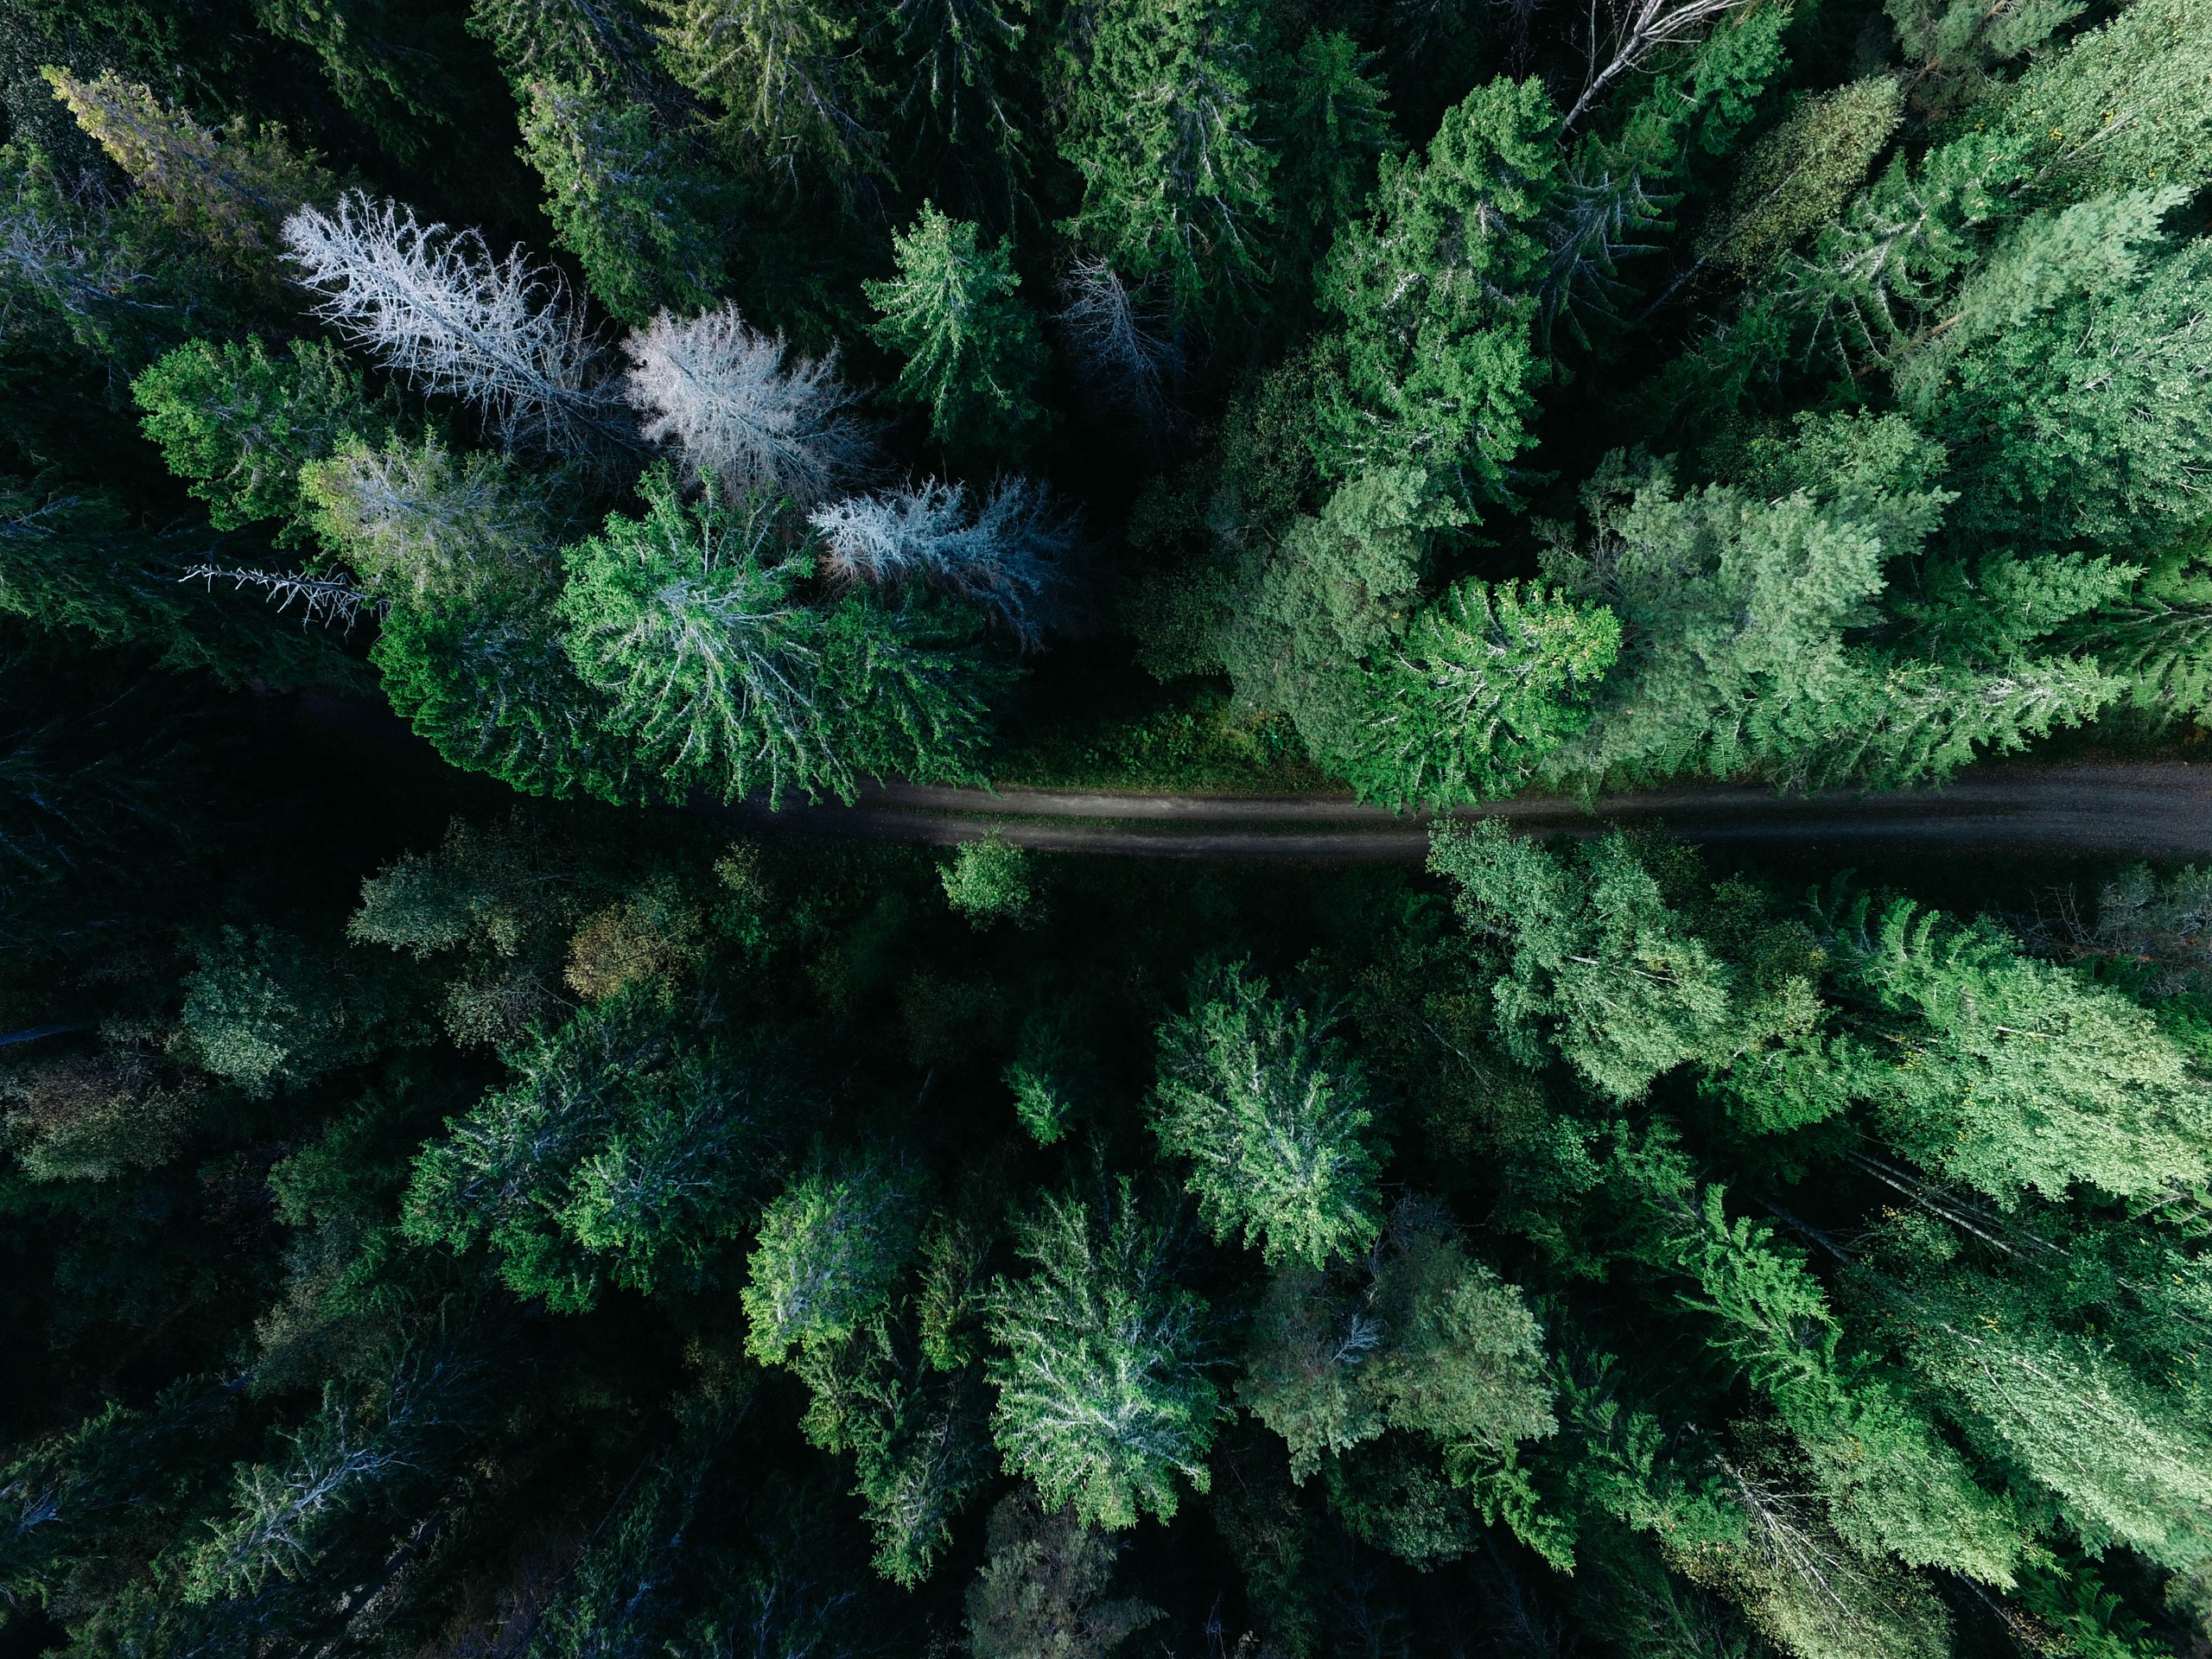
Follow canopy condition, burn severity and harvest activity across managed forest.
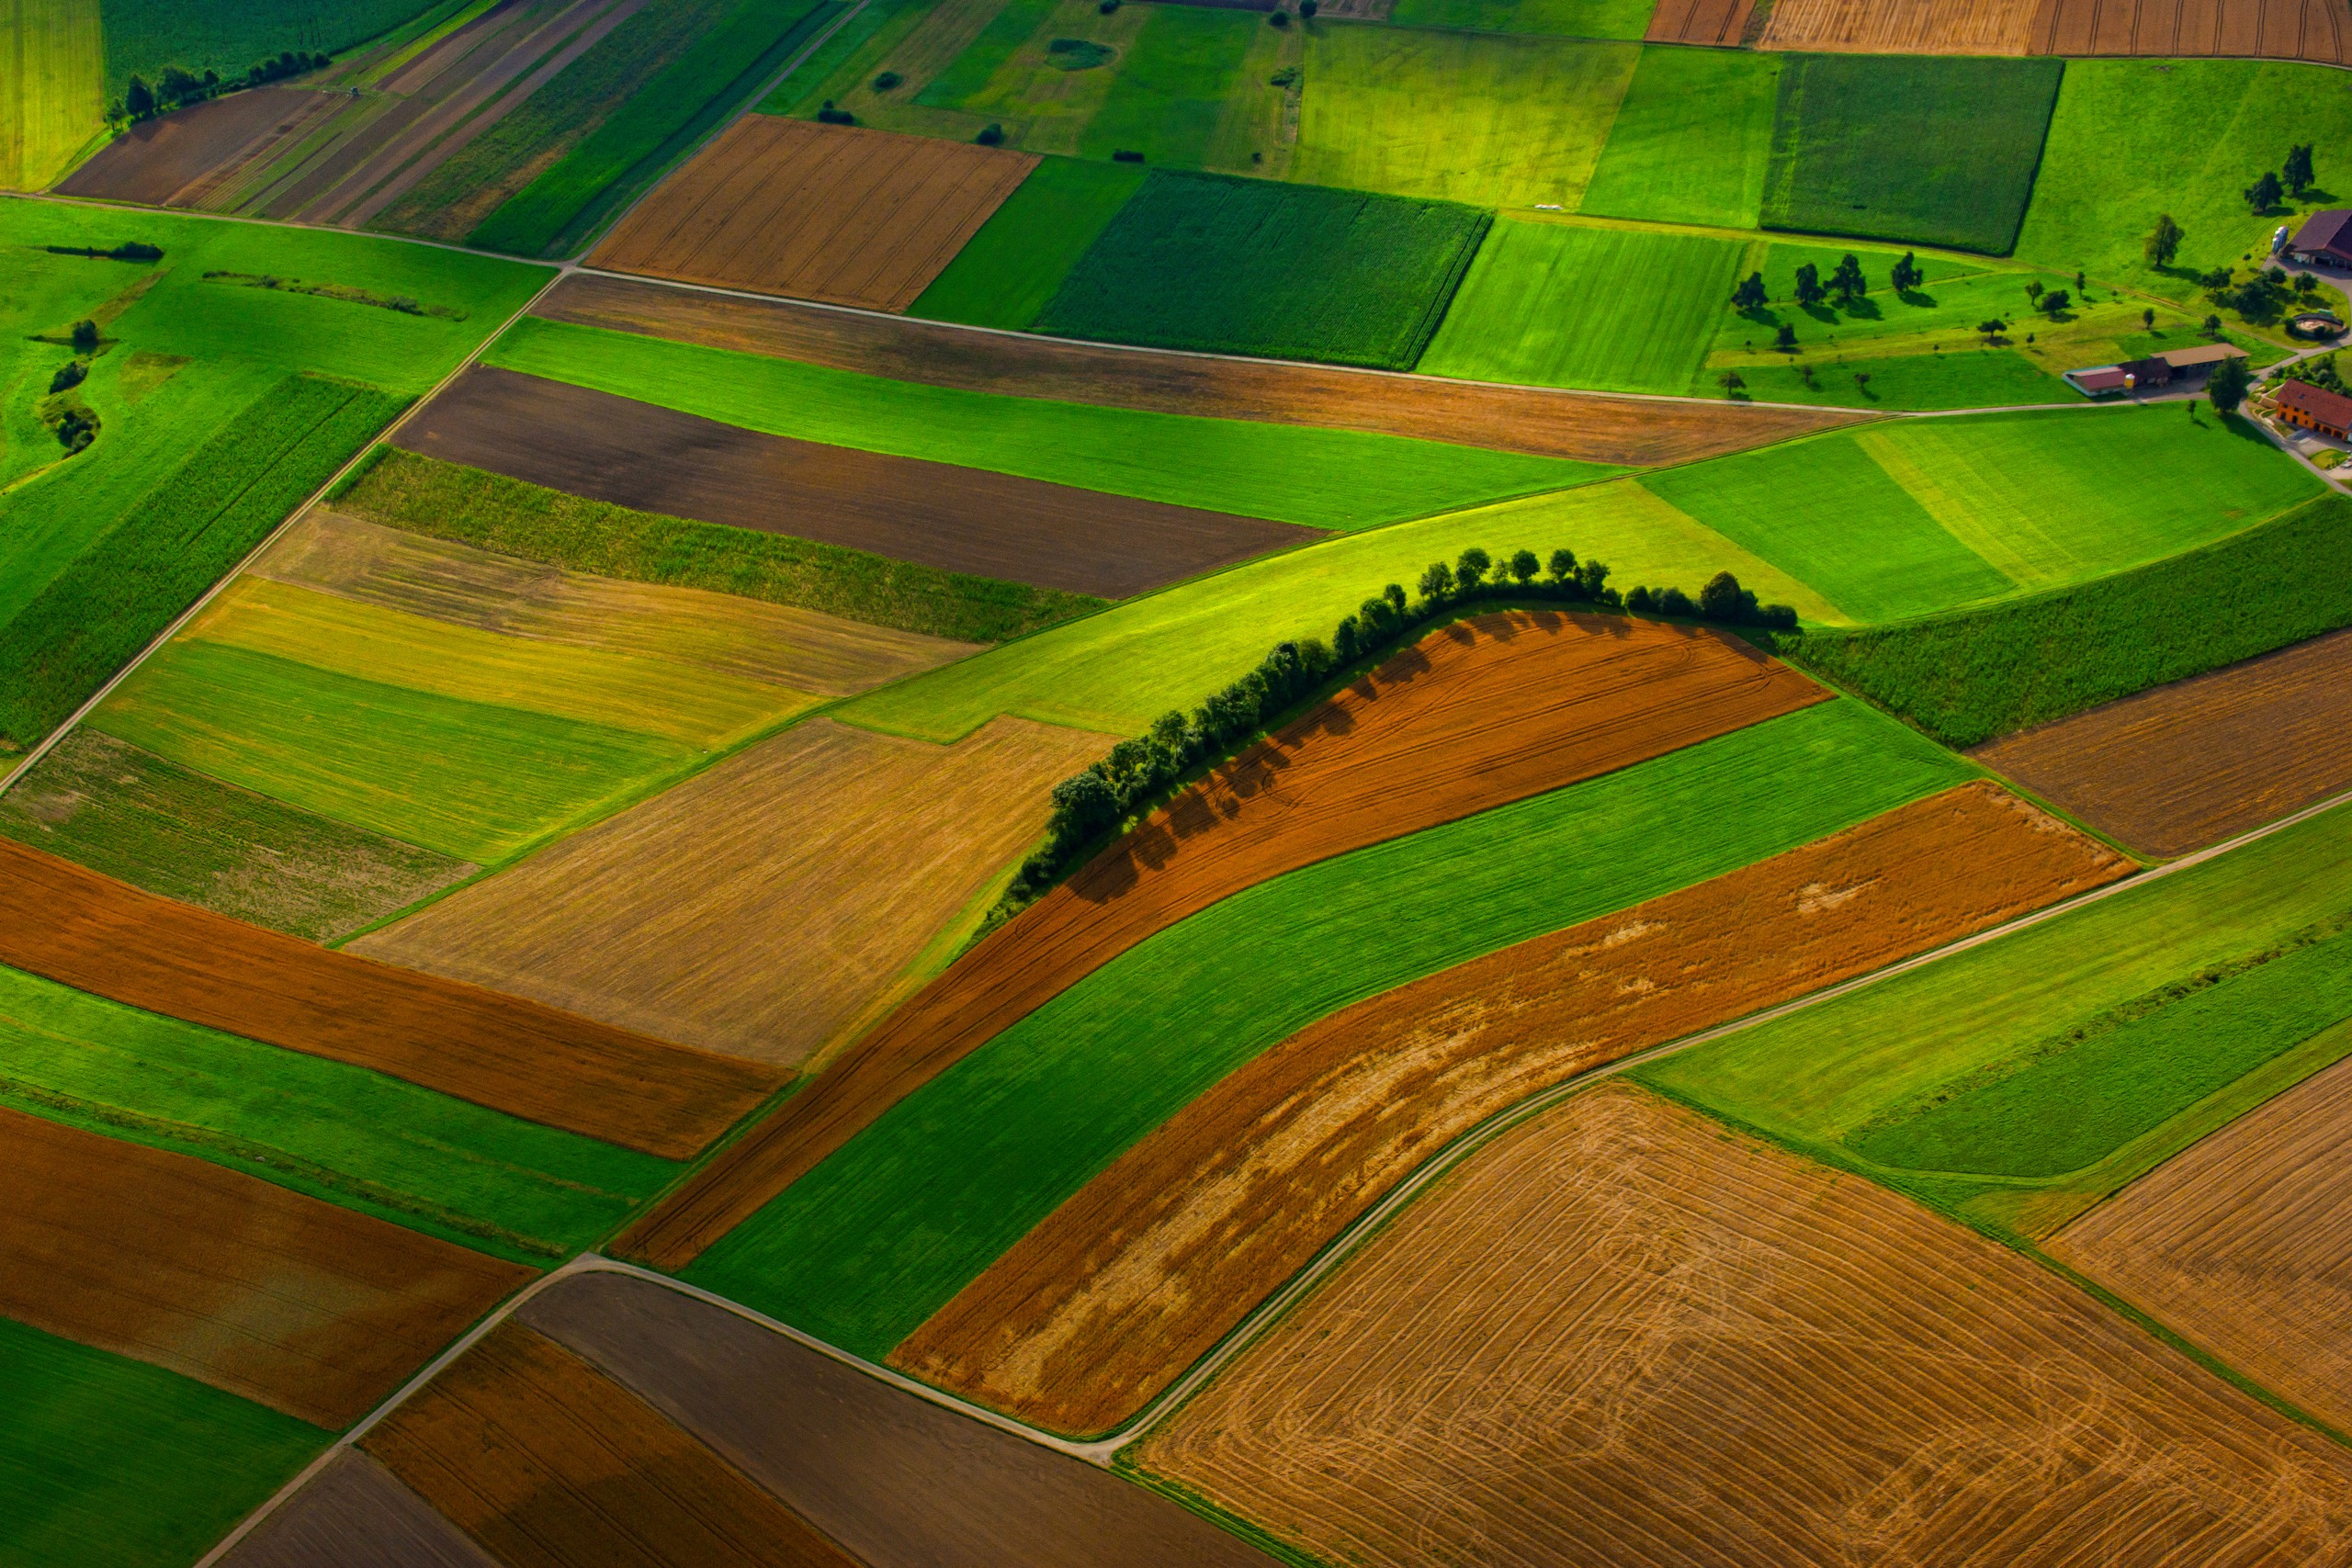
Agriculture
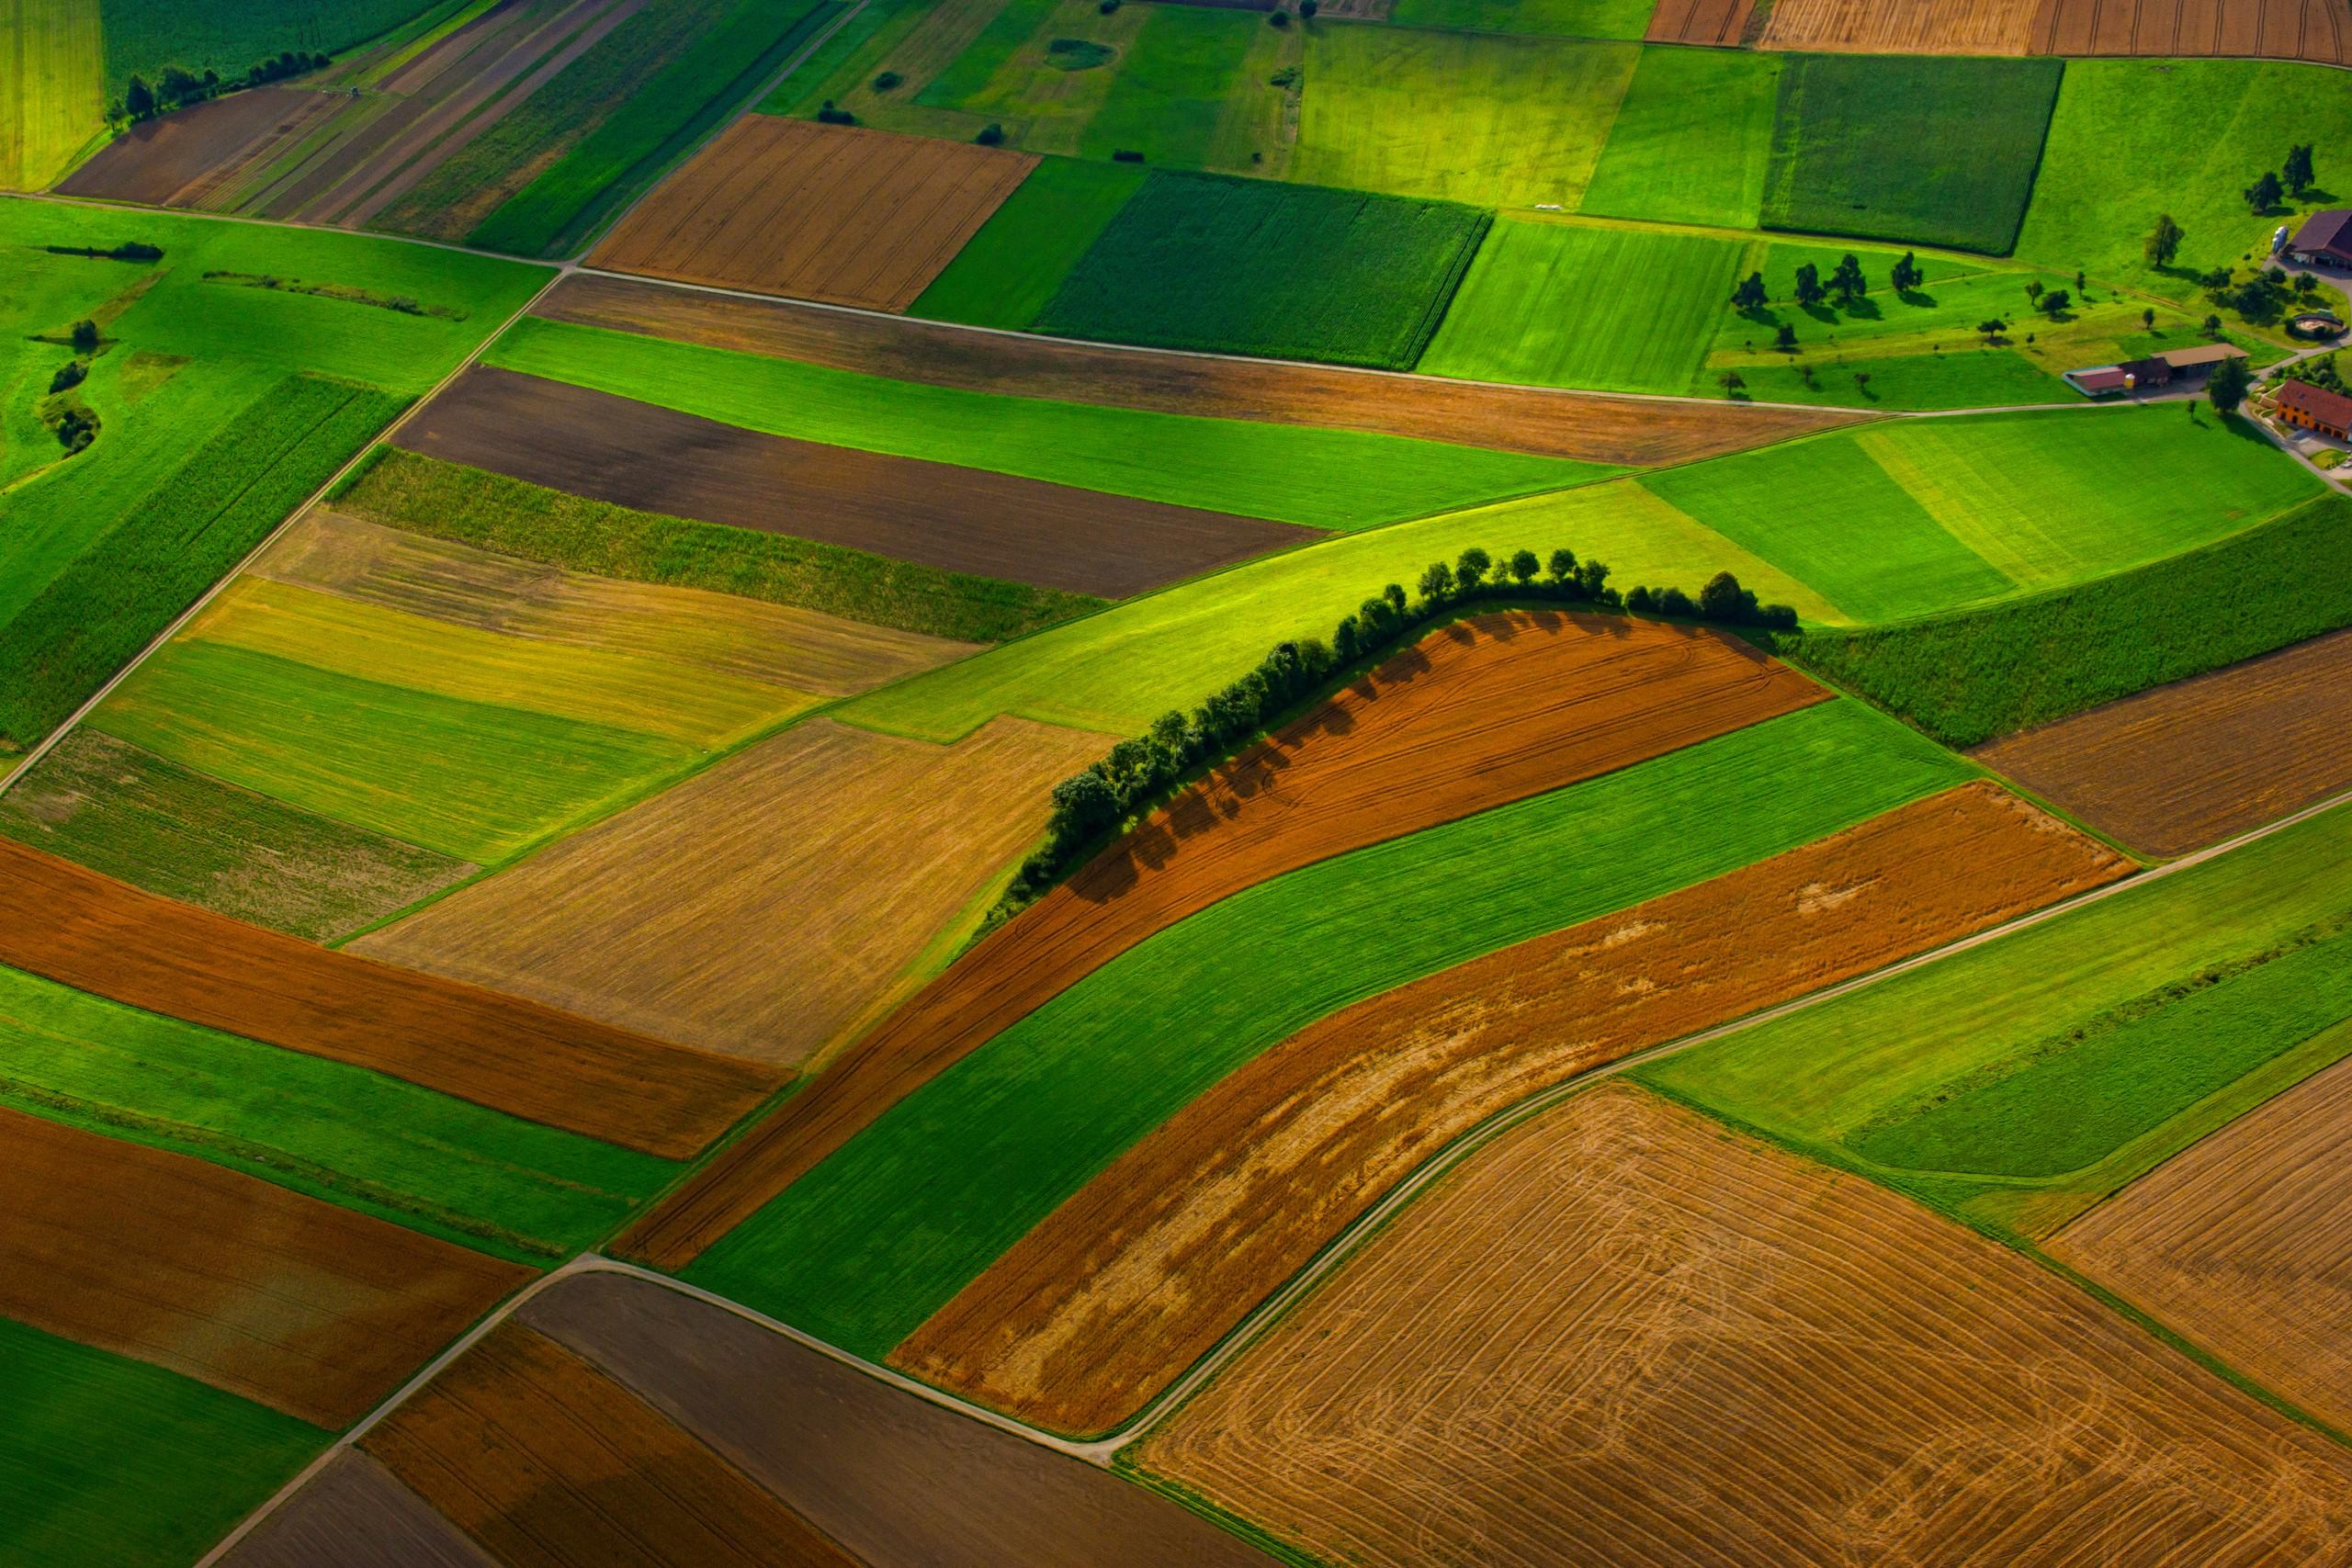
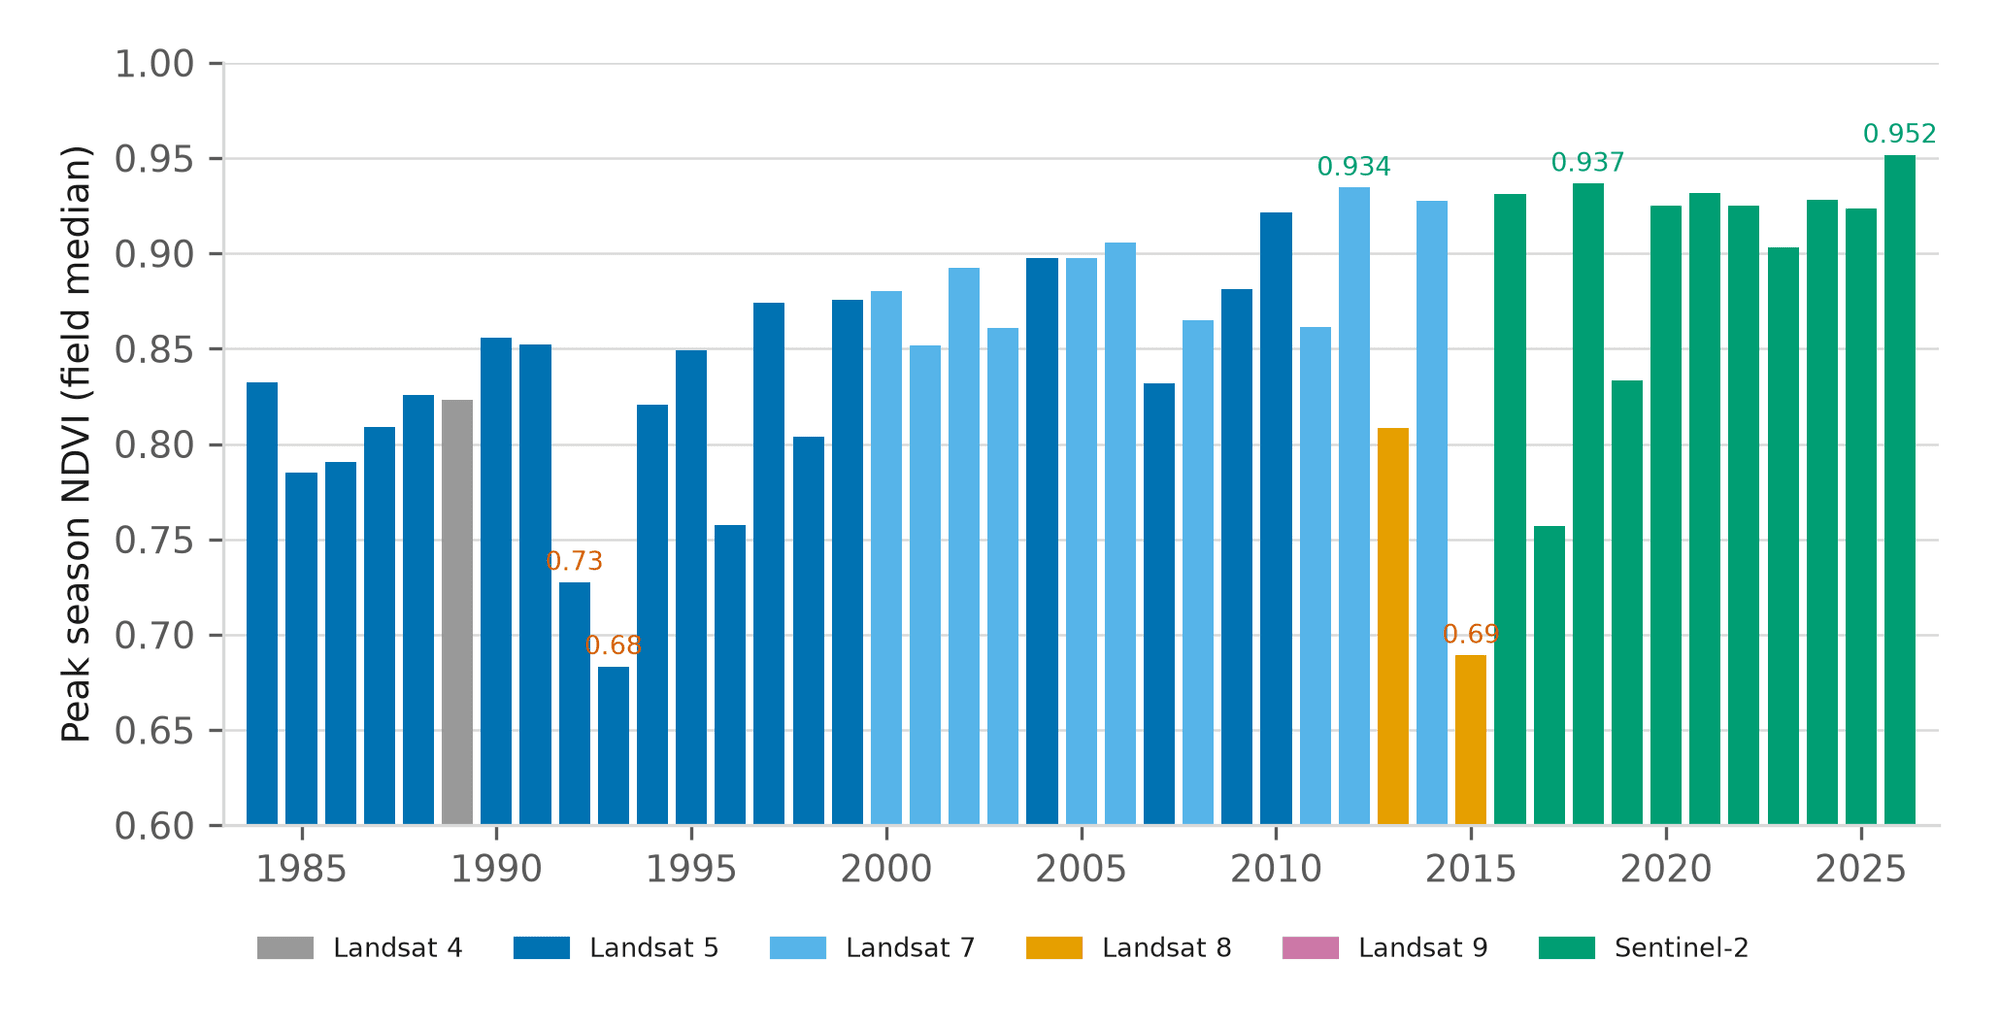
Monitor crop vigour and soil exposure across every field, all season long.
Analytics catalogue
More than sixty analytics covering minerals, water, vegetation, soil and methane. Pick one, point it at your area, and see for yourself.
Alteration Mineral Mapping
Per-pixel alteration mineralogy separating advanced argillic, phyllic and propylitic assemblages.
District Prospectivity Ranking
Regional likelihood scoring for hydrothermal systems, backed by leave-one-region-out cross-validation.
Alteration Cluster Detection
Vectorised clustering that pulls out the core hydrothermal hubs and the nodes worth working outward from.
Lithium Pegmatite Index
Maps lithium-bearing mica by how its signature differs from ordinary white mica.
Gossan & Iron Oxide Speciation
Separates hematite from goethite, and reports the related iron-hydroxyl reading as a ferric class.
Porphyry Cu-Au Vectoring
Vectors toward the hydrothermal centre by tracking how white mica composition shifts across the district.
Methane Plume Detection
Column enhancement over oil and gas facilities. Reviewed public plume products pass through with their provenance, and our own filter runs alongside as screening.
Geothermal Cap Mapping
Finds active and fossil reservoir caps through ammonium minerals, alunite and silica sinter.
Browse the full catalogue
Every analytic, searchable by industry and application.
Why teams choose Lisaris
Everything a remote sensing department would give you, without hiring one.
Answers in minutes
Analyses finish while the meeting is still going, and monitoring keeps watching after you log off.
Priced for real work
No aircraft, no field crews, no procurement cycle for a first look, and plans that scale with your programme.
Anywhere you operate
Global coverage with years of archive behind it, so your baseline is ready on day one.
Plays well with your tools
GeoTIFF, GeoJSON and CSV exports open straight in ArcGIS and QGIS, and an API covers the rest.
Knowledge hub
Explore hyperspectral imaging and Earth observation through our blog posts, whitepapers and case studies across the industries we serve.

Explore Lisaris: satellite analytics across every industry
Read now
Refusal over approximation
Read now
Case study: mapping alteration over a historic Nevada district
Read now
The Spectral Advantage in Mineral Exploration
Read now
The Spectral Advantage in Energy
Read now
The Spectral Advantage in Water Quality
Read nowSubscribe to our newsletter
New analytics, coverage updates and case studies from the team building Lisaris.
One email a month. Unsubscribe whenever you like.